
More Information
Submitted: February 01, 2021 | Approved: February 12, 2021 | Published: February 15, 2021
How to cite this article: Perincek G, Onal C, Avci S. Comparison of clinical, chest CT and laboratory findings of suspected COVID-19 inpatients with positive and negative RT-PCR. J Pulmonol Respir Res. 2021; 5: 019-026.
DOI: 10.29328/journal.jprr.1001019
ORCiD: orcid.org/0000-0002-0992-4192
Copyright License: © 2021 Perincek G, et al. This is an open access article distributed under the Creative Commons Attribution License, which permits unrestricted use, distribution, and reproduction in any medium, provided the original work is properly cited.
Keywords: COVID-19; Chest computed tomography; RT-PCR
Abbreviations: COVID-19; Coronavirus Disease 2019; SARS-Cov-2; Severe Acute Respiratory Syndrome Coronavirus 2; HT: Hypertension, DM; Diabetes Mellitus; CVDs: Cerebrovascular Diseases; RT-PCR: Real-Time Reverse Transcription Polymerase Chain Reaction; CT: Computed Tomography; ED: Emergency Department: COPD: Chronic Obstructive Pulmonary Disease; CAD: Coronary Artery Disease; CHF: Congestive Heart Failure; CRF: Chronic Renal Failure; GGOs: Ground Glass Opacities; ALP: Alkaline Phosphatase; LDH: Lactate Dehydrogenase; MCV: Mean Corpuscular Volume; NLR: Neutrophil-to-Lymphocyte Ratio; pro-BNP: pro-Brain Natriuretic Peptide; INR: International Normalized Ratio; CRP: C-Reactive Protein WBC: White Blood Cell

Comparison of clinical, chest CT and laboratory findings of suspected COVID-19 inpatients with positive and negative RT-PCR
Gokhan Perincek1, Canver Onal2 and Sema Avci3*
1MD, Department of Pulmonology, Kars Harakani State Hospital, Kars, Turkey
2MD, Department of Radiology, Kars Harakani State Hospital, Kars, Turkey
3MD, Department of Emergency Medicine, Medical Faculty, Usak University, Usak, Turkey
*Address for Correspondence: Sema Avci, MD, Department of Emergency Medicine, Usak University Medical Faculty, Usak, Turkey, Tel: +90 530 8431363; Email: [email protected]; [email protected]
Introduction: COVID-19 is an infectious disease caused by the severe acute respiratory syndrome coronavirus 2 and it was first reported in China. The aim of this study was to compare clinical features, chest CT findings and laboratory examinations of suspected COVID-19 inpatients according to RT-PCR analysis.
Methods: Demographics, comorbidites, symptoms and signs, laboratory results and chest CT findings were compared between positive and negative groups. The study included 292 patients (134 females, 158 males) suspected of COVID-19. All statistical calculations were performed with SPSS 23.0.
Results: 158 (54.1%) of the cases were male and 134 (45.9%) were female. Their ages ranged from 17 to 95 years, with an average of 50.46 ± 20.87. A symptom or sign was detected in 86.3% of all patients. The chest CT images of 278 patients were analyzed. Chest CT was negative in 59.2% of patients with positive RT-PCR and 43.9% of patients with negative RT-PCR results. Chest CT findings were atypical or indeterminate in 22.4% of patients with positive RT-PCR results and 20% of patients with negative RT-PCR analysis. ALP, bilirubine, CRP, eosinophil count, glucose, CK-MB mass and lactate were significantly lower in patients with positive RT-PCR test. LDH, lipase, MCV, monocyte, neutrophil count, NLR, platelet, pO2, pro-BNP, procalcitonin, INR, prothrombin time, sodium, troponin T, urea, WBC were significantly lower in patients with positive RT-PCR test results.
Conclusion: The diagnosis of COVID-19 is based on history of patient, typical symptoms or clinical findings. Chest CT, RT-PCR and laboratory abnormalities make the diagnosis of disease stronger.
COVID-19 is an infectious disease caused by the SARS-CoV-2, and it was first reported in Wuhan province of China [1,2]. Despite precautions and restrictions, this disease started to spread all over the world after China and COVID-19 was accepted by the World Health Organization as a pandemic in March 2020 [1]. The severity of the disease varies from asymptomatic to severe pneumonia, respiratory failure and death and also risk factors such as advanced age, HT, DM and cardiovascular diseases increases mortality rates [3]. Patients with COVID-19 infection generally present with fever, dry cough, sore throat, dyspnea, fatigue and myalgia, but less frequently, headache, dizziness, nausea, vomiting and diarrhea may also occur [4]. A highly sensitive and quick diagnostic tests are needed since the symptoms are not specific to the disease and COVID-19 is rapidly progressing to pneumonia and severe respiratory failure [1,4]. Although RT-PCR test for viral nucleic acids in the diagnosis of COVID-19 is the gold standard method, the importance of chest CT is gradually increasing in the rapid diagnosis since RT-PCR can give false negative results [4]. Chest CT is widely used to make a diagnosis due to its high sensitivity up to 98%, although its ionizing radiation content causes reservations in physicians [4]. In hospitals where the suspected COVID-19 patients admissions are high, chest CT can be preferred as a problem solving method considering the risks. COVID-19 is a disease that causes respiratory infection, but multiple involvement including cardiovascular, respiratory, gastrointestinal, neurological, immune and hematopoietic system has been demonstrated [5]. Currently, a clear consensus on the exact effect of COVID-19 on complete blood count, electrolytes, kidney-liver functions, coagulation parameters, arterial blood gas and cardiac tests. Therefore, the laboratory examinations can be affected by the average age of the patients, the severity of the infection, the presence of coexisting diseases, use of drug or alchocol, smoking status and multiple system involvement. Herein, we aimed to compare clinical features, chest CT findings and laboratory examinations of suspected COVID-19 inpatients according to RT-PCR analysis.
Study design and population
This prospective cross-sectional study was conducted with approval of Kafkas University Medical Faculty Ethics Committee between March and June 2020. The study included 292 patients (134 females, 158 males) suspected of COVID-19 admitted to ED.
Nasopharyngeal sample was taken from the patients who were accepted as clinically suspicious and hospitalized by the physicians in the ED or chest CT was planned for them in terms of clinical signs. Patients aged 16 years or more, presenting with any of the weakness, fatigue, fever, arthralgia, headache, nausea, vomiting, diarrhea, dyspnea, cough, sore throat, chest pain, shiver, anosmia, ageusia, abdominal pain, xerostomia and loss of appetite were considered as suspected patients for COVID-19. A contact history of a patient with accurate COVID-19 diagnosis, healthcare professionals without using protective equipments for COVID-19, any people sharing with the same class, room, office, hotel and dormitory with COVID-19 patients, shaking hands or facing with the COVID-19 patients for more than 15 minutes in less than one meter distance, people travelled with the COVID-19 patients on the same plane (two front, two back, two right, and two left) within 14 days were included in the study. Verbal and written consent were obtained from all patients.
A nasopharyngeal sample was taken from all COVID-19 suspected patients included in the study, and then the patients were divided into two as positive and negative groups according to the RT-PCR results. Repeated tests for diagnosis were not applied to the patients. The COVID-19 diagnosis was confirmed by chest CT in patients who were symptomatic and had negative RT-PCR test results. Chest CT was not planned for any of the asymptomatic patients. Age, gender, history of contact with COVID-19, smoking status, vitals, comorbidites, symptoms and signs, laboratory results and chest CT findings were recorded and compared between positive and negative groups. The laboratory tests were analyzed within 2 hours after admission to ED including serum electrolytes, liver-kidney-cardiac functions, complete blood count, coagulation parameters, inflammatory markers and arterial blood gas analysis.
Chest CT protocols
Chest CT images were obtained at the end-inspiration level with patients in supine position and arms were elevated. All patients’ chest CT images were acquired by using a 16-slice Toshiba Alexion CT scanner (Toshiba Medical Systems, Nasu, Japan) with patients in supine position. The scanning parameters were as follow: tube voltage = 120 kVP, automatic tube current modulation (30-80 mAs), pitch = 0.93- 1.43 mm, matrix = 512 x 512 slice thickness = 2 mm, field of view = 370 mm x 370 mm. All axial images with slice thickness of 2 mm acquired with fast scan method.
Image analysis
Chest CT images were evaluated by the same radiologist experienced with 7 years and were classified according to British Society of Thoracic Imaging for COVID-19 classification [6]. The radiologist classified the lesion patterns on chest CT scans as bilateral peripherally, lower predominant GGOs +/- consolidation, bilateral peripherally basal consolidation, multifocal ground GGOs +/- consolidation, peripheral bronchial widening, halo sign, converse halo sign, crazy paving pattern, widened vascular pedicle, perilobullary pattern, indeterminate, unilateral GGOs +/- consolidation, Perihilar GGOs +/- consolidation, diffuse GGOs, few, small, non-peripheral GGOs, perihilar consolidation, atypical or indeterminate/non-spesific/incompatible pattern, incompatible, lober pneumonia, bronchopneumonia, centrilobular nodules, tree in bud, cavitation, pleural effusion, interlobular septal thickening, fluid in the fissure/phantom tumor, pulmonary fibrosis and lymphadenopathy (Figures 1-4).
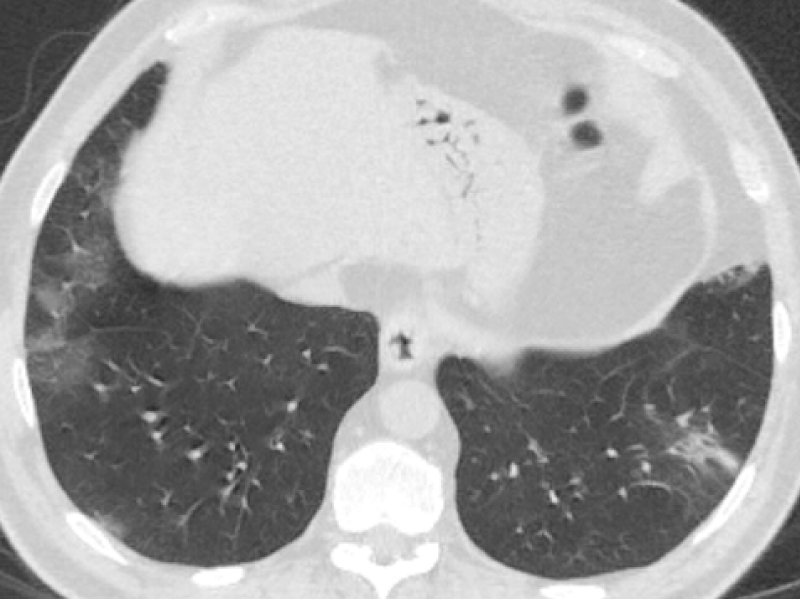
Figure 1: 60-year-old male complaining of dry cough, tiredness. Chest CT images revealed bilateral-multilobar, multiple peripheral GGOs in both lungs. Findings were typical for COVID-19. (RT-PCR test was positive).
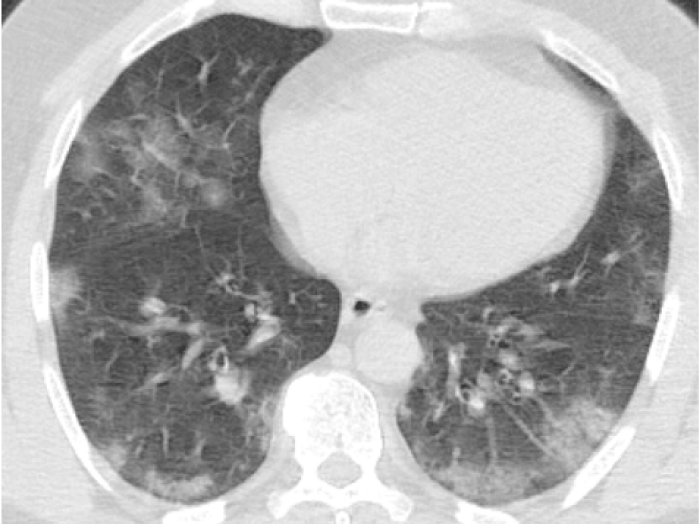
Figure 2: 55-year-old male presented with dry cough, fever. Chest CT sequential images revealed bilateral-multilobar, basal dominant, peripheral GGOs. Images were typical for COVID-19. (RT-PCR test was positive).
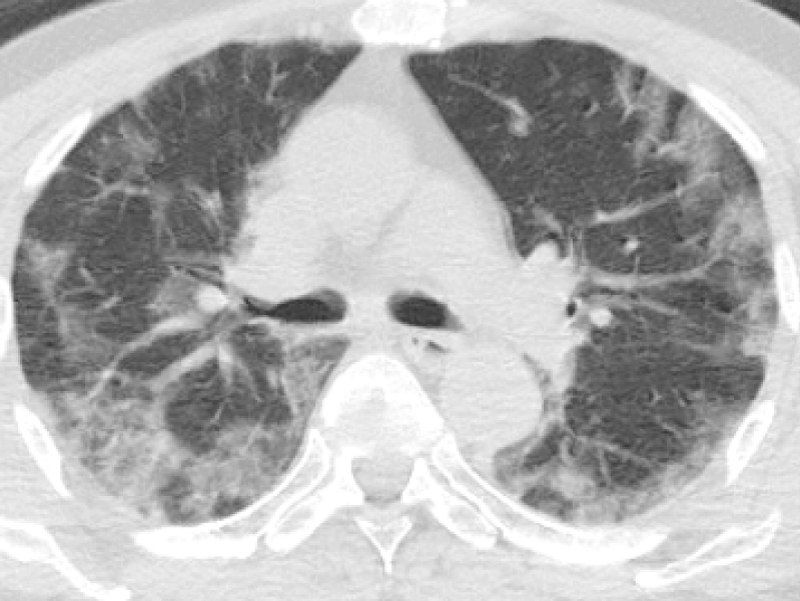
Figure 3: 77-year-old male presented with fever and dry cough for five days. Chest CT images revealed bilateral-multilobar, peripheral dominant, GGOs with sparing some of the subpleural areas. Findings were typical for COVID-19. (RT-PCR test was positive).
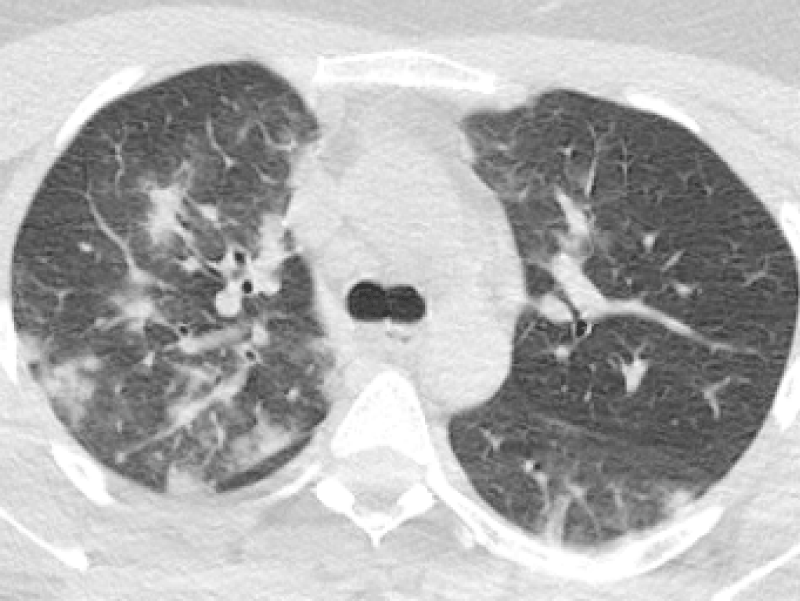
Figure 4: 30-year-old female complaining of dry cough and fever. Chest CT sequential images revealed bilateral-multilobar, multiple peripheral GGOs and subpleural consolidations. Findings were consistent with COVID-19. (RT-PCR test was positive).
Statistical reviews
All statistical calculations were performed with SPSS 23.0 (SPSS for Windows, Chicago, IL, SA). The continuous variables were expressed as mean±standard deviation; categoric variables were defined as percentages (%). The normal distribution was determined by histogram and Kolmogorov-Smirnov test. Mean values of continuous variables were compared between the groups using Mann-Whitney U test. The results were evaluated as 95% confidence interval and p value < 0.05, which was considered statistically significant.
Table 1 lists demographics, comorbidities and clinical characteristics of the cases. Accordingly, 158 (54.1%) of the cases were male and 134 (45.9%) were female. Their ages ranged from 17 to 95 years, with an average of 50.46 ± 20.87. 31 (29.2%) of the positive RT-PCR cases were current smoker, 56 (52.8%) were non-smoker and 18 (17%) were ex-smoker. The frequency of comorbidities seen among the positive RT-PCR patients were: COPD (16%), asthma (2.8%), hypertension (17%), CAD (6.6%), CHF (3.8%), CRF (1.9%), DM (5.7%), rheumatoid arthritis (0.9%), neoplastic disease (0.9%), hypothyroidism (0.9%), epilepsy (0.9%), cerebral palsy (0.9%) and CVD (0.9%). A symptom or sign was detected in 86.3% of all patients. The frequency of clinical signs and symptoms seen among the positive RT-PCR patients were: Weakness or fatigue (21.7%), fever (19.8%), arthralgia (11.3%), headache (16%), nausea and vomiting (8.5%), diarrhea (1.9%), dyspnea (17.9%), cough (29.2%), sore throat (15.1%), chest pain (4.7%), shiver (4.7%), anosmia (1.9%), ageusia (2.8%), abdominal pain (0.9%) and loss of appetite (1.9%). The respiratory rate of all patients ranged between 16 and 37 per minute with an average of 20.7 ± 4.98. The systolic blood pressure of all cases varied between 80 and 160 mmHg, with an average of 117.12 ± 11.63. The fever of all cases ranged from 36.1 to 39.8 oC, with an average of 36.56 ± 0.33. The heart rate of all cases varied between 65 and 140 per minute, with an average of 86.68 ± 12.08. The oxygen saturation of all cases ranged from 18% to 99%, with an average of 92.72 ± 5.77.
| Table 1: Demographic properties, comorbidities and clinical findings of the patients. | ||||
| RT-PCR results | n | % | ||
| Gender | (+) | Male | 56 | 52.8 |
| Female | 50 | 47.2 | ||
| (-) | Male | 102 | 54.8 | |
| Female | 84 | 45.2 | ||
| Smoking status | (+) | Never smoker | 56 | 52.8 |
| Current smoker | 31 | 29.2 | ||
| Ex smoker | 18 | 17.0 | ||
| (-) | Never smoker | 87 | 46.8 | |
| Current smoker | 49 | 26.3 | ||
| Ex smoker | 50 | 26.9 | ||
| COPD | (+) | + | 17 | 16.0 |
| - | 89 | 84.0 | ||
| (-) | + | 57 | 30.6 | |
| - | 129 | 69.4 | ||
| Asthma | (+) | + | 3 | 2.8 |
| - | 103 | 97.2 | ||
| (-) | + | 6 | 3.2 | |
| - | 180 | 96.8 | ||
| Hypertension | (+) | + | 18 | 17.0 |
| - | 88 | 83.0 | ||
| (+) | + | 63 | 33.9 | |
| - | 123 | 66.1 | ||
| CAD | (+) | + | 7 | 6.6 |
| - | 99 | 93.4 | ||
| (-) | + | 20 | 10.8 | |
| - | 166 | 89.2 | ||
| CHF | (+) | + | 4 | 3.8 |
| - | 102 | 96.2 | ||
| (-) | + | 10 | 5.4 | |
| - | 176 | 94.6 | ||
| CRF | (+) | + | 2 | 1.9 |
| - | 104 | 98.1 | ||
| (-) | + | 7 | 3.8 | |
| - | 179 | 96.2 | ||
| DM | (+) | + | 6 | 5.7 |
| - | 100 | 94.3 | ||
| (-) | + | 21 | 11.3 | |
| - | 165 | 88.7 | ||
| Rheumatoid arthritis | (+) | + | 1 | 0.9 |
| - | 105 | 99.1 | ||
| (-) | + | - | - | |
| - | 186 | 100.0 | ||
| Lung cancer | (+) | + | - | - |
| - | 106 | 100.0 | ||
| (-) | + | 2 | 1.1 | |
| - | 184 | 98.9 | Neoplastic disease | (+) | + | 1 | 0.9 |
| - | 105 | 99.1 | ||
| (-) | + | 4 | 2.2 | |
| - | 182 | 97.8 | ||
| Hypothyroidism | (+) | + | 1 | 0.9 |
| - | 105 | 99.1 | ||
| (-) | + | 3 | 1.6 | |
| - | 183 | 98.4 | ||
| Epilepsy | (+) | + | 1 | 0.9 |
| - | 105 | 99.1 | ||
| (-) | + | 2 | 1.1 | |
| - | 184 | 98.9 | ||
| Cerebral palsy | (+) | + | 1 | 0.9 |
| - | 105 | 99.1 | ||
| (-) | + | 2 | 1.1 | |
| - | 184 | 98.9 | ||
| Atrial fibrillation | (+) | + | - | - |
| - | 106 | 100.0 | ||
| (-) | + | 5 | 2.7 | |
| - | 181 | 97.3 | ||
| CVD | (+) | + | 1 | 0.9 |
| - | 105 | 99.1 | ||
| (-) | + | 7 | 3.8 | |
| - | 179 | 96.2 | ||
| Symptoms | (+) | + | 78 | 73.6 |
| - | 28 | 26.4 | ||
| (-) | + | 174 | 93.5 | |
| - | 12 | 6.5 | ||
| Weakness or fatigue | (+) | + | 23 | 21.7 |
| - | 83 | 78.3 | ||
| (-) | + | 39 | 21.0 | |
| - | 147 | 79.0 | ||
| Fever | (+) | + | 21 | 19.8 |
| - | 85 | 80.2 | ||
| (-) | + | 33 | 17.7 | |
| - | 153 | 82.3 | ||
| Arthralgia | (+) | + | 12 | 11.3 |
| - | 94 | 88.7 | ||
| (-) | + | 10 | 5.4 | |
| - | 176 | 94.6 | ||
| Headache | (+) | + | 17 | 16.0 |
| - | 89 | 84.0 | ||
| (-) | + | 32 | 17.3 | |
| - | 153 | 82.7 | ||
| Nausea or vomiting | (+) | + | 9 | 8.5 |
| - | 97 | 91.5 | ||
| (-) | + | 13 | 7.0 | |
| - | 173 | 93.0 | Diarrhea | (+) | + | 2 | 1.9 |
| - | 104 | 98.1 | ||
| (-) | + | 2 | 1.1 | |
| - | 184 | 98.9 | ||
| Dyspnea | (+) | + | 19 | 17.9 |
| - | 87 | 82.1 | ||
| (-) | + | 57 | 30.6 | |
| - | 129 | 69.4 | ||
| Cough | (+) | + | 31 | 29.2 |
| - | 75 | 70.8 | ||
| (-) | + | 68 | 36.6 | |
| - | 118 | 63.4 | ||
| Sore throat | (+) | + | 16 | 15.1 |
| - | 90 | 84.9 | ||
| (-) | + | 21 | 11.3 | |
| - | 165 | 88.7 | ||
| Chest pain | (+) | + | 5 | 4.7 |
| - | 101 | 95.3 | ||
| (-) | + | 23 | 12.4 | |
| - | 162 | 87.6 | ||
| Shiver | (+) | + | 5 | 4.7 |
| - | 101 | 95.3 | ||
| (-) | + | 7 | 3.8 | |
| - | 179 | 96.2 | ||
| Anosmia | (+) | + | 2 | 1.9 |
| - | 104 | 98.1 | ||
| (-) | + | - | - | |
| - | 185 | 100.0 | ||
| Ageusia | (+) | + | 3 | 2.8 |
| - | 103 | 97.2 | ||
| (-) | + | - | - | |
| - | 186 | 100.0 | ||
| Abdominal pain | (+) | + | 1 | 0.9 |
| - | 105 | 99.1 | ||
| (-) | + | 9 | 4.8 | |
| - | 177 | 95.2 | ||
| Xerostomia | (+) | + | 1 | 0.9 |
| - | 105 | 99.1 | ||
| (-) | + | - | - | |
| - | 186 | 100.0 | ||
| Loss of appetite | (+) | + | 2 | 1.9 |
| - | 103 | 97.2 | ||
| (-) | + | - | - | |
| - | 186 | 100.0 | ||
The chest CT images of 278 patients were analyzed. Chest CT was negative in 59.2% of patients with positive RT-PCR results and 43.9% of patients with negative RT-PCR test results. Chest CT findings were atypical or indeterminate in 22.4% of patients with positive RT-PCR results and 20% of patients with negative RT-PCR test results. Table 2 lists chest CT findings of cases according to RT-PCR test results. The findings in the chest CT were determined according to the positive and negative RT-PCR results, in the following freguency, respectively: Bilateral peripherally, lower predominant GGOs +/- consolidation (19.4%, 12.2%), bilateral peripherally basal consolidation (2%, 0.6%), multifocal ground GGOs +/- consolidation (4.1%, 2.8%), peripheral bronchial widening (4.1%, 8.9%), converse halo sign (1%, 0.6%), crazy paving pattern (2%, -), widened vascular pedicle (-, 0.6%), indeterminate (17.3%, 20%), unilateral GGOs +/- consolidation (12.2%, 16.7%), perihilar GGOs +/- consolidation (1%, 0.6%), diffuse GGOs (3.1%, 1.7%), few, small, non-peripheral GGOs (1%, 2.2%), atypical or indeterminate/ non-spesific/incompatible pattern (8.2%, 5.6%), incompatible (9.2%, 25.6%), lober pneumonia (3.1%, 10%), bronchopneumonia (-, 2.2%), centrilobular nodules (1%, 1.7%), tree in bud (1%, 5%), cavitation (-, 0.6%), pleural effusion (4.1%, 7.8%), interlobular septal thickening (2%, 6.1%), fluid in the fissure/phantom tumor (1%, 1.7%), pulmonary fibrosis (1%, 2.8%).
| Table2: Chest CT findings of patients accordingto RT-PCR results. | ||||
| RT-PCR results | n | % | ||
| Bilateral peripherally, lowerpredominant GGOs +/- consolidation | (+) | + | 19 | 19.4 |
| - | 79 | 80.6 | ||
| (-) | + | 22 | 12.2 | |
| - | 158 | 87.8 | ||
| Bilateral peripherally basalconsolidation | (+) | + | 2 | 2.0 |
| - | 96 | 98.0 | ||
| (-) | + | 1 | .6 | |
| - | 179 | 99.4 | ||
| Multifocal ground GGOs +/- consolidation | (+) | + | 4 | 4.1 |
| - | 94 | 95.9 | ||
| (-) | + | 5 | 2.8 | |
| - | 175 | 97.2 | ||
| Peripheral bronchial widening | (+) | + | 4 | 4.1 |
| - | 94 | 95.9 | ||
| (-) | + | 16 | 8.9 | |
| - | 164 | 91.1 | ||
| Halo sign | (+) | + | - | - |
| - | 98 | 100.0 | ||
| (-) | + | - | - | |
| - | 180 | 100.0 | ||
| Converse halo sign | (+) | + | 1 | 1.0 |
| - | 97 | 99.0 | ||
| (-) | + | 1 | .6 | |
| - | 179 | 99.4 | ||
| Crazy paving pattern | (+) | + | 2 | 2.0 |
| - | 96 | 98.0 | ||
| (-) | + | - | - | |
| - | 180 | 100.0 | ||
| Widened vascular pedicle | (+) | + | - | - |
| - | 98 | 100.0 | ||
| (-) | + | 1 | 0.6 | |
| - | 179 | 99.4 | ||
| Perilobullary pattern | (+) | + | - | - |
| - | 98 | 100.0 | ||
| (-) | + | - | - | |
| - | 180 | 100.0 | ||
| Indeterminate | (+) | + | 17 | 17.3 |
| - | 81 | 82.7 | ||
| (-) | + | 36 | 20.0 | |
| - | 144 | 80.0 | ||
| Unilateral GGOs +/- consolidation | (+) | + | 12 | 12.2 |
| - | 86 | 87.8 | ||
| (-) | + | 30 | 16.7 | |
| - | 150 | 83.3 | ||
| Perihilar GGOs +/- consolidation | (+) | + | 1 | 1.0 |
| - | 97 | 99.0 | ||
| (-) | + | 1 | .6 | |
| - | 179 | 99.4 | ||
| Diffuse GGOs | (+) | + | 3 | 3.1 |
| - | 95 | 96.9 | ||
| (-) | + | 3 | 1.7 | |
| - | 177 | 98.3 | ||
| Few, small, non-peripheral GGOs | (+) | + | 1 | 1.0 |
| - | 97 | 99.0 | ||
| (-) | + | 4 | 2.2 | |
| - | 176 | 97.8 | ||
| Perihilar consolidation | (+) | + | - | - |
| - | 98 | 100.0 | ||
| (-) | + | - | - | |
| - | 179 | 100.0 | ||
| Atypical or indeterminate/Non-spesific/Incompatible pattern | (+) | + | 8 | 8.2 |
| - | 90 | 91.8 | ||
| (-) | + | 10 | 5.6 | |
| - | 169 | 94.4 | ||
| Incompatible | (+) | + | 9 | 9.2 |
| - | 89 | 90.8 | ||
| (-) | + | 46 | 25.6 | |
| - | 134 | 74.4 | ||
| Lober pneumonia | (+) | + | 3 | 3.1 |
| - | 95 | 96.9 | ||
| (-) | + | 18 | 10.0 | |
| - | 162 | 90.0 | ||
| Bronchopneumonia | (+) | + | - | - |
| - | 98 | 100.0 | ||
| (-) | + | 4 | 2.2 | |
| - | 176 | 97.8 | ||
| Centrilobular nodules | (+) | + | 1 | 1.0 |
| - | 97 | 99.0 | ||
| (-) | + | 3 | 1.7 | |
| - | 177 | 98.3 | ||
| Tree in bud | (+) | + | 1 | 1.0 |
| - | 97 | 99.0 | ||
| (-) | + | 9 | 5.0 | |
| - | 171 | 95.0 | Cavitation | (+) | + | - | - |
| - | 98 | 100.0 | ||
| (-) | + | 1 | .6 | |
| - | 179 | 99.4 | ||
| Pleural effusion | (+) | + | 4 | 4.1 |
| - | 94 | 95.9 | ||
| (-) | + | 14 | 7.8 | |
| - | 166 | 92.2 | ||
| Interlobular septal thickening | (+) | + | 2 | 2.0 |
| - | 96 | 98.0 | ||
| (-) | + | 11 | 6.1 | |
| - | 169 | 93.9 | ||
| Fluid in the fissure/Phantom tumor | (+) | + | 1 | 1.0 |
| - | 97 | 99.0 | ||
| (-) | + | 3 | 1.7 | |
| - | 177 | 98.3 | ||
| Pulmonary fibrosis | (+) | + | 1 | 1.0 |
| - | 97 | 99.0 | ||
| (-) | + | 5 | 2.8 | |
| - | 175 | 97.2 | ||
| Lymphadenopathy | (+) | + | - | - |
| - | 95 | 100.0 | ||
| (-) | + | - | - | |
| - | 179 | 100.0 | ||
Table 3 lists analysis of blood parameters with Mann Whitney U test between RT-PCR positive and negative groups. ALP, direct bilirubine, total bilirubine, eosinophil count, blood glucose, CK-MB mass and lactate were significantly lower in patients with positive RT-PCR test results, respectively (z = -2.328; p < 0.05, z = -1.994; p < 0.05, z = -2.725; p < 0.01, z = -2.214; p < 0.05, z = -2.981; p < 0.001, z = -2.490; p < 0.05, z = -2.155; p < 0.05). LDH, MCV, monocyte, neutrophil count, NLR, platelet, pO2, pro-BNP, procalcitonin, INR, prothrombin time, troponin T, urea were significantly lower in patients with positive RT-PCR test results, respectively (z = -2.395; p < 0.05, z = -2.696; p < 0.01, z = -4.236; p < 0.01, z = -7.888; p < 0.01, z = -6.706; p < 0.01, z = -1.970; p < 0.05, z = -2.471; p < 0.05, z = -1.964; p < 0.05, z = -3.311; p < 0.01, z = -2.137; p < 0.05, z = -2.013; p < 0.05, z = -3.847; p < 0.01, z = -3.405; p < 0.01). CRP (z = -5.425; p < 0.01) and WBC were significantly lower in patients with positive RT-PCR group. Lipase (z = -3.113; p < 0.01) and sodium (z = -2.683; p < 0.01) were significantly higher in positive RT-PCR group.
| Table 3: Comparisons of blood analysis of RT-PCRpositive and negative groups. | |||||||
| RT-PCR | n | Meanrank | Sum ofrank | U | z | p | |
| Albumin | (+) | 90 | 137.53 | 12378.00 | 6657.000 | -1.437 | 0.151 |
| (-) | 166 | 123.60 | 20518.00 | ||||
| ALP | (+) | 87 | 110.93 | 9651.00 | 5823.000 | -2.328 | .020* |
| (-) | 163 | 133.28 | 21724.00 | ||||
| Alanineaminotransferase | (+) | 93 | 138.36 | 12867.50 | 7220.500 | -1.087 | 0.277 |
| (-) | 169 | 127.72 | 21585.50 | ||||
| Amilaz | (+) | 27 | 46.28 | 1249.50 | 694.500 | -.836 | 0.403 |
| (-) | 58 | 41.47 | 2405.50 | ||||
| aPTT | (+) | 81 | 107.39 | 8698.50 | 5377.500 | -.806 | 0.420 |
| (-) | 142 | 114.63 | 16277.50 | ||||
| Aspartateaminotransferase | (+) | 93 | 133.61 | 12425.50 | 7662.500 | -.334 | 0.738 |
| (-) | 169 | 130.34 | 22027.50 | ||||
| Basophil | (+) | 95 | 124.23 | 11802.00 | 7242.000 | -1.365 | 0.172 |
| (-) | 169 | 137.15 | 23178.00 | ||||
| Bilirubin(direct) | (+) | 90 | 116.47 | 10482.50 | 6387.500 | -1.994 | .046* |
| (-) | 167 | 135.75 | 22670.50 | ||||
| Bilirubin(total) | (+) | 87 | 107.20 | 9326.50 | 5498.500 | -2.725 | .006** |
| (-) | 160 | 133.13 | 21301.50 | ||||
| HCO3 | (+) | 81 | 114.51 | 9275.00 | 5954.000 | -1.175 | 0.240 |
| (-) | 162 | 125.75 | 20371.00 | ||||
| Chlor | (+) | 81 | 132.36 | 10721.50 | 5721.500 | -1.630 | 0.103 |
| (-) | 162 | 116.82 | 18924.50 | ||||
| CRP | (+) | 91 | 94.05 | 8559.00 | 4373.000 | -5.425 | .000** |
| (-) | 163 | 146.17 | 23826.00 | ||||
| D-dimer | (+) | 77 | 102.99 | 7930.00 | 4927.000 | -1.955 | 0.051 |
| (-) | 152 | 121.09 | 18405.00 | ||||
| Eosinophil | (+) | 95 | 118.66 | 11272.50 | 6712.500 | -2.214 | .027* |
| (-) | 169 | 140.28 | 23707.50 | ||||
| Ferritin | (+) | 77 | 101.53 | 7818.00 | 48415.000 | -1.533 | 0.125 |
| (-) | 143 | 115.33 | 16492.00 | ||||
| Phospor | (+) | 76 | 106.11 | 8064.00 | 5138.000 | -.663 | 0.507 |
| (-) | 143 | 112.07 | 16026.00 | ||||
| GGT | (+) | 90 | 121.05 | 10894.50 | 6799.500 | -1.037 | 0.300 |
| (-) | 164 | 131.04 | 21490.50 | ||||
| Glucose | (+) | 90 | 106.92 | 9622.50 | 5527.500 | -2.981 | .003** |
| (-) | 159 | 135.24 | 21502.50 | ||||
| Hematocrit | (+) | 95 | 121.65 | 11556.50 | 6996.500 | -1.873 | 0.061 |
| (-) | 171 | 140.08 | 23954.50 | ||||
| Hemoglobine | (+) | 95 | 122.67 | 11654.00 | 7094.000 | -1.568 | 0.117 |
| (-) | 169 | 138.02 | 23326.00 | ||||
| Calcium | (+) | 92 | 120.11 | 11050.00 | 6772.000 | -1.653 | 0.098 |
| (-) | 168 | 136.19 | 22880.00 | ||||
| Creatinekinase | (+) | 83 | 116.92 | 9704.00 | 5983.000 | -.242 | 0.808 |
| (-) | 147 | 114.70 | 16861.00 | ||||
| Creatinine | (+) | 93 | 119.76 | 11138.00 | 6767.000 | -1.789 | 0.074 |
| (-) | 168 | 137.22 | 23053.00 | ||||
| CK-MB mass | (+) | 76 | 94.55 | 7185.50 | 4259.500 | -2.490 | 0.013* |
| (-) | 141 | 116.79 | 16467.50 | Lactate | (+) | 81 | 107.43 | 8701.50 | 5380.500 | -2.155 | 0.031* |
| (-) | 160 | 127.87 | 20459.50 | ||||
| LDH | (+) | 66 | 86.95 | 5738.50 | 3527.500 | -2.395 | .017* |
| (-) | 135 | 107.87 | 14562.50 | ||||
| Lipase | (+) | 31 | 50.00 | 1550.00 | 434.000 | -3.113 | 0.002** |
| (-) | 48 | 33.54 | 1610.00 | ||||
| Lymphocyte | (+) | 95 | 140.34 | 13332.50 | 7282.500 | -1.251 | 0.211 |
| (-) | 169 | 128.09 | 21647.50 | ||||
| Magnesium | (+) | 76 | 108.37 | 8236.00 | 5310.000 | -.443 | 0.658 |
| (-) | 145 | 112.38 | 16295.00 | ||||
| MCH | (+) | 95 | 121.92 | 11582.00 | 7022.000 | -1.689 | 0.091 |
| (-) | 169 | 138.45 | 23398.00 | ||||
| MCV | (+) | 95 | 115.61 | 10982.50 | 6422.500 | -2.696 | 0.007** |
| (-) | 169 | 142.00 | 23997.50 | ||||
| Monocyte | (+) | 95 | 105.95 | 10065.50 | 5505.500 | -4.236 | 0.000** |
| (-) | 169 | 147.42 | 24914.50 | ||||
| Mean plateletvolume | (+) | 95 | 138.67 | 13174.00 | 7441.000 | -.985 | 0.324 |
| (-) | 169 | 129.03 | 21806.00 | ||||
| Neutrophil | (+) | 95 | 83.06 | 7891.00 | 3331.000 | -7.888 | 0.000** |
| (-) | 169 | 160.29 | 27089.00 | ||||
| NLR | (+) | 95 | 90.17 | 8566.50 | 4006.500 | -6.706 | 0.000** |
| (-) | 168 | 155.65 | 26149.50 | ||||
| pCO2 | (+) | 81 | 125.36 | 10154.00 | 6289.000 | -.527 | 0.598 |
| (-) | 162 | 120.32 | 19492.00 | ||||
| PCT | (+) | 95 | 121.81 | 11572.00 | 7012.000 | -1.706 | 0.088 |
| (-) | 169 | 138.51 | 23408.00 | ||||
| PDW | (+) | 95 | 123.92 | 11772.50 | 7212.500 | -1.372 | 0.170 |
| (-) | 169 | 137.32 | 23207.50 | ||||
| pH | (+) | 81 | 114.97 | 9312.50 | 5991.500 | -1.175 | 0.240 |
| (-) | 163 | 126.24 | 20577.50 | ||||
| Platelet | (+) | 95 | 120.15 | 11414.50 | 6854.500 | -1.970 | 0.049* |
| (-) | 169 | 139.44 | 23565.50 | ||||
| pO2 | (+) | 81 | 105.82 | 8571.50 | 5250.500 | -2.471 | 0.013* |
| (-) | 161 | 129.39 | 20831.50 | ||||
| Pro-BNP | (+) | 48 | 49.96 | 2398.00 | 1222.000 | -1.964 | 0.049* |
| (-) | 65 | 62.20 | 4043.00 | ||||
| Procalcitonin | (+) | 82 | 98.34 | 8063.50 | 4660.500 | -3.311 | 0.001** |
| (-) | 154 | 129.24 | 19902.50 | ||||
| INR | (+) | 81 | 102.36 | 8291.50 | 4970.500 | -2.137 | 0.033* |
| (-) | 148 | 121.92 | 18043.50 | ||||
| Prothrombintime | (+) | 81 | 103.09 | 8350.50 | 5029.500 | -2.013 | 0.044* |
| (-) | 148 | 121.52 | 17984.50 | ||||
| RBC | (+) | 95 | 128.72 | 12228.00 | 7668.000 | -.604 | 0.546 |
| (-) | 169 | 134.63 | 22752.00 | ||||
| RDW | (+) | 95 | 122.16 | 11605.00 | 7045.000 | -1.651 | 0.099 |
| (-) | 169 | 138.31 | 23375.00 | ||||
| Sedimentation | (+) | 73 | 83.51 | 6096.50 | 3395.000 | -1.766 | 0.077 |
| (-) | 110 | 97.63 | 10739.50 | ||||
| Sodium | (+) | 94 | 148.19 | 13929.50 | 6327.500 | -2.683 | 0.007** |
| (-) | 168 | 122.16 | 20523.50 | ||||
| Troponin T | (+) | 79 | 95.42 | 7538.50 | 4378.500 | -3.847 | 0.000** |
| (-) | 157 | 130.11 | 20427.50 | ||||
| Urea | (+) | 93 | 109.62 | 10194.50 | 5823.500 | -3.405 | 0.001* |
| (-) | 168 | 142.84 | 23996.50 | ||||
| WBC | (+) | 95 | 87.26 | 8289.50 | 3729.500 | -7.218 | 0.000** |
| (-) | 169 | 157,93 | 26690,50 | ||||
| *p < 0.01; **p< 0.05 | |||||||
In the study, COVID-19 infection was diagnosed on the basis of chest CT findings, RT-PCR results and suspected patients were hospitalized without waiting for the results and treatments were started. Chest CT was negative in 59.2% of patients with positive RT-PCR results and 43.9% of patients with negative RT-PCR. Chest CT findings were atypical or indeterminate in 22.4% of patients with positive RT-PCR results and 20% of patients with negative RT-PCR test results. Chest CT findings were not normal in the majority of the patients who had negative RT-PCR (56.1%) and also the rate of normal chest CT findings was higher in patients with positive RT-PCR tests (52.9%). Chest CT may be a more reliable diagnostic method to diagnose COVID-19 pneumonia. In the study of Ai, et al. [7] positive RT-PCR rate was 59% and positive chest CT rate was 88% among all suspected COVID-19 patients. In the same study, the rate of abnormal chest CT among those with negative RT-PCR results was 75% and it was higher than our results [7]. In the study of Fang, et al. [8] the rate of abnormal CT findings compatible with COVID-19 at the admission of patients was 98%, and the positive RT-PCR rate among the same group was 70.6% [8].
We found that bilateral peripherally, lower predominant GGOs +/- consolidation, indeterminate, unilateral GGOs +/- consolidation findings rate were higher between positive and negative RT-CPR groups. Ai, et al. [7] found that the most common chest CT findings consistent with COVID-19 pneumonia as consolidation (50%) and GGOs (46%), respectively. The distribution of pulmonary lesions on CT in COVID-19 pneumonia is generally located bilateral and peripheral [8]. The most common chest CT abnormalities in the study of Ding, et al. [9] about COVID-19 staging were GGOs, crazy-paving pattern, consolidation and linear opacities. Similarly, Fang, et al. [8] Long, et al. [10] and Ma, et al. [11] reported that GGOs in lower lobes (72%), GGOs with consolidations (52.7%) and GGOs (58%), respectively. Peripheral GGOs are the most common chest CT findings since the disease initially involves the terminal bronchi and alveoli, and abnormalities may vary at the stage when the disease is diagnosed. The incidence of common manifestations in our study was lower than these studies, which may be due to patients’ late admission to the hospital or the effects of COVID-19 in different populations.
On the other hand, in the study ALP, direct bilirubine, total bilirubine, CRP, eosinophil count, glucose, CK-MB mass, lactate, LDH, MCV, monocyte, neutrophil count, NLR, platelet, pO2, pro-BNP, procalcitonin, INR, prothrombin time, troponin T, urea, WBC were significantly lower in patients with positive RT-PCR test results (p < 0.05). In our study, the normality rate of chest CT was higher among patients with positive RT-PCR results, while the normality rate was lower among those with RT-PCR negative. Obviously, CT is a more valuable method to diagnose, treat and follow-up for symptomatic COVID-19 patients. Therefore, the statistically low values of these blood parameters in the positive RT-PCR group cannot indicate that these values may be low in admission patients with COVID-19. In the literature, Cai, et al. [12] reported that COVID-19 patients diagnosed with RT-PCR had a significant increase in liver tests including ALT, AST, GGT, ALP, total bilirubin, and this higher level could predict the severity of the disease. In the study of Li, et al. [13] leukocyte count, neutrophils, eosinophils, and platelets were lower and hs-CRP was higher in COVID-19 patients diagnosed with RT-PCR and monocyte count, red blood cell and hemoglobin were similar to the control group. According to the severity of the symptoms, Zhu, et al. [14] divided the patients with COVID-19 into four groups: mild, moderate, severe and critical. Neutrophil %, NLR, fibrinogen and CRP were significantly higher and lymphocyte %, lymphocyte count and platelets were significantly lower in the severe group; pO2 and pCO2 were higher in the non-severe group; troponin I and pro-BNP did not indicated difference between the severe and non-severe groups. Bonetti, et al. [15] compared the patients who were hospitalized for COVID-19 as survivors and non-survivors. Blood glucose, AST, CK, LDH, urea, creatinine, high-sensitive troponin I, prothrombin time, INR, aPTT, d-dimer, CRP, ferritin, WBC and neutrophils were statistically higher and albumin, lipase and hemoglobin were lower in non-survivors. Although decrease lymphocyte, increased CRP and LDH are the most frequently determined laboratory abnormalities, definitive diagnostic markers of COVID-19 are not reported [16.]
This single-centre study had some limitations. To begin with, the size of the patient population was relatively small and we did not determine accurate diagnosis of COVID-19 with RT-PCR, chest CT or specific laboratory parameter. The nonhomogenous findings of chest CT may affect the definitive results of the study. RT-PCR or chest CT is not sufficient to confirm the diagnosis, since the patients did not have a tissue biopsy.
In conclusion, the diagnosis is based on history of patient, typical symptoms or clinical findings. Chest CT, RT-PCR and laboratory abnormalities make the diagnosis of COVID-19 stronger.
- Anjorin AA. The coronavirus disease 2019 (COVID-19) pandemic: A review and an update on cases in Africa. Asian Pac J Trop Med 2020; 13: 199-203.
- Akçay Ş, Ozlu T, Yılmaz A. Radiological approaches to COVID-19 pneumonia. Turk J Med Sci. 2020; 50: 604-610. PubMed: https: //pubmed.ncbi.nlm.nih.gov/32299200/
- Abobaker A, Raba AA, Alzwi A. Extrapulmonary and atypical clinical presentations of COVID‐19. J Med Virol. 2020; 1–7. PubMed: https: //www.ncbi.nlm.nih.gov/pmc/articles/PMC7300507/
- Özdemir M, Taydas O, Öztürk MH. COVID-19 enfeksiyonunda toraks bilgisayarlı tomogra_bulguları. J Biotechnol and Strategic Health Res. 2020; 1: 91-96.
- Terpos E, Ioannis Ntanasis-Stathopoulos, Ismail Elalamy, Efstathios Kastritis,Theodoros N. Sergentanis1, et al. Hematological findings and complications of COVID-19. Am J Hematol. 2020; 95: 834-847. PubMed: https: //pubmed.ncbi.nlm.nih.gov/32282949/
- British Thoracic Radiology Society. COVID-19 CT Classification. 2020.
- Ai T, Yang Z, Hou H, Zhan C, Chen C, et al. Correlation of chest CT and RT-PCR testing in coronavirus disease 2019 (COVID-19) in China: A report of 1014 cases. Radiology. 2020: 26: 296: E32-E40. PubMed: https: //pubmed.ncbi.nlm.nih.gov/32101510/
- Fang Y, Zhang H, Xie J, Lin M, Ying L, Pang P, et al. Sensitivity of chest CT for COVID-19: comparison to RT-PCR. Radiology. 2020; 296: E115-E117. PubMed: https: //pubmed.ncbi.nlm.nih.gov/32073353/
- Xa D, Xub J, Zhouc J, Qingyun Long Q. Chest CT findings of COVID-19 pneumonia by duration of symptoms. Eur J Radiol. 2020; 127: 109009. PubMed: https: //pubmed.ncbi.nlm.nih.gov/32325282/
- Long C, Xu H, Shen Q, Zhang X, Fan B, Wang C, et al. Diagnosis of the Coronavirus disease (COVID-19): rRT-PCR or CT? Eur J Radiol. 2020; 25: 108961. PubMed: https: //pubmed.ncbi.nlm.nih.gov/32229322/
- Ma H, Hu J, Tian J, Zhou X, Li H, Laws MT, et al. A single-center, retrospective study of COVID-19 features in children: a descriptive investigation. BMC Med. 2020; 18: 123. PubMed: https: //pubmed.ncbi.nlm.nih.gov/32370747/
- Cai Q, Huang D, Yu H, Zhu Z, Xia Z, et al. COVID-19: Abnormal liver function tests. J Hepatol. 2020; 73: 566-574. PubMed: https: //pubmed.ncbi.nlm.nih.gov/32298767/
- Li Q, Dinga X, Xiab G, Chend HG, Chena F, et al. Eosinopenia and elevated C-reactive protein facilitate triage of COVID-19 patients in fever clinic: A retrospective case-control study. EClinicalMedicine. 2020; 23: 100375. PubMed: https: //pubmed.ncbi.nlm.nih.gov/32368728/
- Zhua Z, Caib T, Fanb L, Loub K, Huab X, et al. Clinical value of immune-inflammatory parameters to assess the severity of coronavirus disease 2019. Int J Infect Dis. 2020; 95: 332–339. PubMed: https: //pubmed.ncbi.nlm.nih.gov/32334118/
- Bonetti G, Manelli F, Patroni A, Bettinardi A, Borrelli G, et al. Laboratory predictors of death from coronavirus disease 2019 (COVID-19) in the area of Valcamonica, Italy. Clin Chem Lab Med. 2020; 58: 1100-1105. PubMed: https: //pubmed.ncbi.nlm.nih.gov/32573995/
- Fu L, Wang B, Yuan T, Chen X, Ao Y, et al. Clinical characteristics of coronavirus disease 2019 (COVID-19) in China: A systematic review and meta-analysis. J Infect. 2020; 80: 656–665. PubMed: https: //pubmed.ncbi.nlm.nih.gov/32283155/