
More Information
Submitted: February 21, 2024 | Approved: March 14, 2024 | Published: March 15, 2024
How to cite this article: Friedman SH, Williams J, Hyer M, Fox N, Ramakrishnan V, et al. Longitudinal Risk Phenotyping in Incident Systemic Sclerosis-associated Pulmonary Arterial Hypertension (SSc-PAH): An Unsupervised Cluster Analysis of the PHAROS Registry. J Pulmonol Respir Res. 2024; 8: 015-022.
DOI: 10.29328/journal.jprr.1001053
Copyright License: © 2024 Friedman SH, et al. This is an open access article distributed under the Creative Commons Attribution License, which permits unrestricted use, distribution, and reproduction in any medium, provided the original work is properly cited.

Longitudinal Risk Phenotyping in Incident Systemic Sclerosis-associated Pulmonary Arterial Hypertension (SSc-PAH): An Unsupervised Cluster Analysis of the PHAROS Registry
Samuel H Friedman1*, Jacob Williams2, Madison Hyer2, Nicholas Fox1, Viswanathan Ramakrishnan2, Matthew R Lammi3, Virginia D Steen4 and Rahul G Argula1
1Division of Pulmonary, Critical Care, Allergy and Sleep Medicine, Medical University of South Carolina, Charleston, SC, USA
2Department of Public Health Services, Medical University of South Carolina, Charleston, SC, USA
3Johns Hopkins University, Baltimore, MD, USA
4Georgetown University Medical Center, Washington D.C, USA
*Address for Correspondence: Samuel H Friedman, MD, Division of Pulmonary, Critical Care, Allergy and Sleep Medicine, Medical University of South Carolina, Clinical Sciences Building, CSB 96 Jonathan Lucas Street, 8th Floor, Suite: 816, Charleston, SC 29425, USA, Email: [email protected]
Background: Systemic sclerosis-associated pulmonary arterial hypertension (SSc-PAH) is characterized by pulmonary arterial remodeling resulting in right ventricular failure and death if untreated. Despite therapeutic advances, there is survival variability within the SSc-PAH population. The aim of this study was to delineate high-risk subgroups of SSc-PAH using readily available clinical parameters.
Methods: We analyzed data from the PHAROS database, a prospective observational registry of incident SSc-PAH patients. Latent class modeling was performed based on trends in 6MWD over time. We compared survival between the clusters regarding baseline clinical parameters and changes in these parameters over time.
Results: We identified four unique groups within 103 patients meeting our inclusion criteria, based on trajectories of 6MWD. Patients in Cluster 4 exhibited a decline in 6MWD over time and had the worst prognosis with a median survival of 3 years. Patients in Cluster 3, with the lowest baseline 6MWD, were associated with lower median survival (5 years) when compared to Clusters 1 and 2 (> 9 and 7 years, respectively), despite an improvement in 6MWD over time. There were no meaningful changes in SF-36 and WHO functional class between the clusters, but BNP trended higher over time in the higher-risk clusters.
Conclusion: We identified high-risk subsets of SSc-PAH characterized by significantly worse survival. Incident SSc-PAH patients with a decline in 6MWD over time or low baseline 6MWD had worse survival when compared to SSc-PAH patients who demonstrated relatively stable or mild reduction in 6MWD over time.
Pulmonary arterial hypertension (PAH) is a leading cause of morbidity and mortality among systemic sclerosis (SSc) patients [1-3]. Systemic sclerosis-associated pulmonary arterial hypertension (SSc-PAH) accounts for a significant percentage of PAH as a whole, representing 15% - 30% of all PAH cases in North America and Europe [4,5].
Given the high prevalence and an adverse long-term prognosis for SSc-PAH, current guidelines suggest annual screening for PH among SSc patients using trans-thoracic echocardiography (TTE) to enable early disease identification [6]. While the use of targeted vasodilator therapies over the past two decades has led to improvements in the quality of life and mortality in idiopathic PAH (IPAH) patients, these trends have not uniformly translated to the SSc-PAH population [7-10]. The Pulmonary Hypertension Assessment and Recognition of Outcomes in Scleroderma (PHAROS) registry is a multicenter, prospective registry of patients in the United States with incident (diagnosed within 6 months) SSc-associated pulmonary hypertension [11]. Prospective data from this registry demonstrated short-term survival rates for SSc-PAH patients that were comparable with those of the idiopathic PAH patients [12]. Despite these improvements in the short-term survival data for SSc-PAH patients, their long-term survival continues to be worse when compared to IPAH patients [13,14]. Given these poor outcomes, it is important to identify SSc-PAH patients who are at high risk for bad outcomes early in the disease course. There have been several risk stratification tools developed for PAH patients, including the REVEAL 2.0 (Registry to Evaluate Early and Long-Term PAH Disease Management) risk calculator and the 2015 ESC/ERS risk stratification guidelines. These tools stratify patients with PAH into low, intermediate, and high risks depending on their one-year mortality [15,16]. While the REVEAL prognostic equation has recently been shown to have good concordance when used to predict mortality in an incident SSc-PAH cohort, the model discrimination and calibration were not as accurate in predicting the actual observed survival in the highest-risk cohorts [17].
Our aim was to identify and characterize high-risk endotypes of SSc-PAH using longitudinal analysis of functional status, assessed by changes in 6-minute walk distance (6MWD). An unsupervised cluster analysis approach was utilized to group patients based on similar trajectories of 6MWD over time. We then compared mortality between the groups to determine distinct survival phenotypes.
Study population and inclusion criteria
The Pulmonary Hypertension Assessment and Recognition of Outcomes in Scleroderma (PHAROS) study is a United States-based prospective, multi-center, observational registry of systemic sclerosis patients at risk for or diagnosed with incident PAH [11]. The aim of our study was to identify high-risk SSc-PAH phenotypes among PHAROS patients with incident PAH based on 6MWD, as it is a readily available clinical measure. Incident PAH was defined as a diagnosis of PAH by right heart catheterization (RHC) within 6 months of study enrollment. The diagnosis of PAH was determined by the enrolling investigator based on PHAROS enrollment criteria: mPAP ≥ 25 mmHg and PCWP ≤ 15 mmHg, without significant interstitial lung disease as determined by FVC (Forced Vital Capacity) ≥ 65% predicted and absent or mild ILD (Interstitial lung disease) on HRCT [11,18] An mPAP cutoff of 25 mmHg was used to diagnose PAH based on the prevalent hemodynamic definitions at the time of PHAROS registry creation [19]. For this analysis, we only included SSc-PAH patients with at least two recorded values for the following clinical parameters to ensure adequate longitudinal data: 6MWD, B-type natriuretic peptide (BNP), quality of life as measured by the 36-item Short Form survey (SF-36), and World Health Organization functional class (WHO FC). Complete details regarding patient selection are displayed in Figure 1.
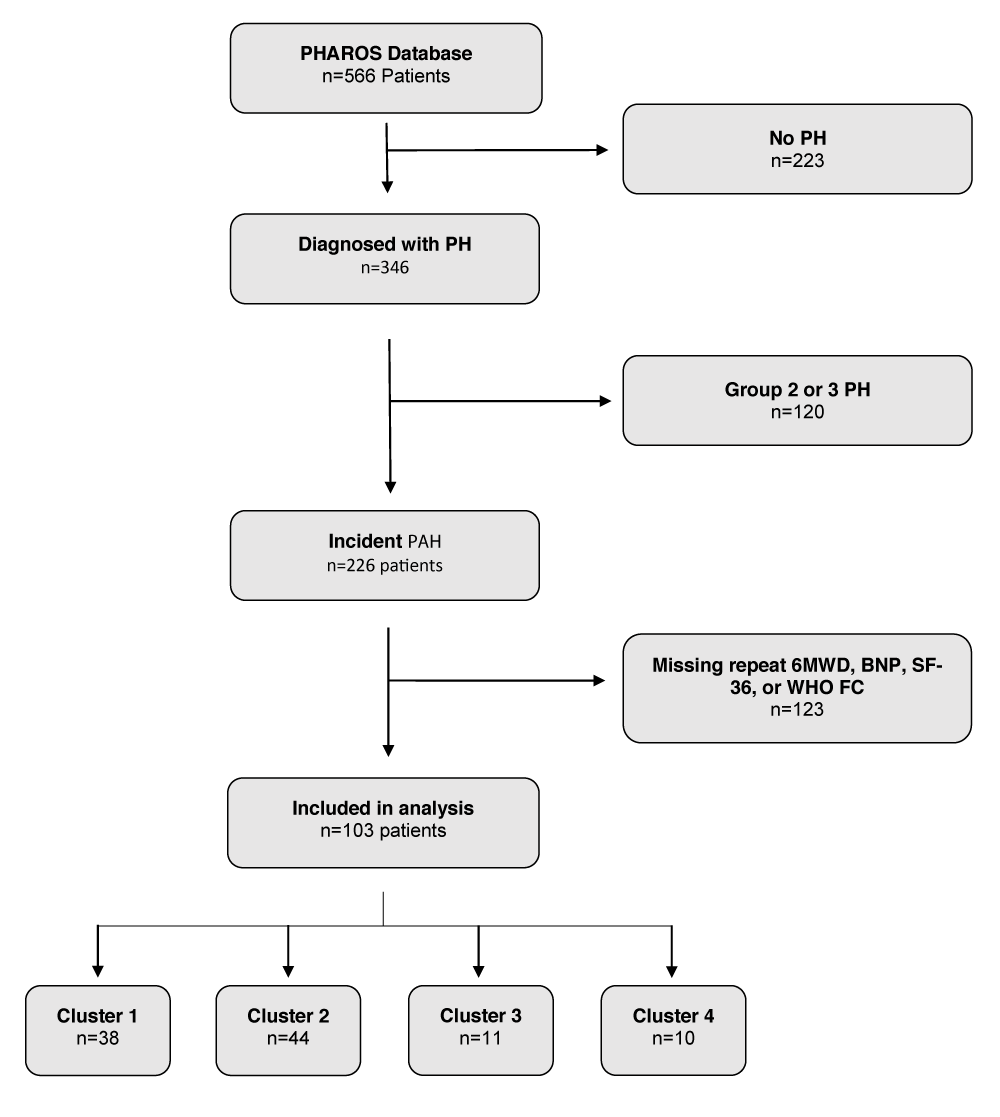
Figure 1: Consort Diagram.
Statistical analysis
Latent class modeling allows for the detection of subgroups within a population that exhibit similar tendencies [20]. 6MWD is a widely used clinical measurement to assess disease functional status and predict prognosis, and changes in 6MWD are commonly used as surrogate endpoints in PAH clinical trials [21,22]. After identifying patients meeting our inclusion criteria we performed a latent class model analysis to identify unique subsets within the cohort, based on similar trajectories in 6MWD over time. First, 6MWD values for each patient were plotted over the study period (Figure 2). Next, using linear regression to model predicted slopes for aggregated patients, unsupervised cluster analysis identified four unique latent clusters of incident SSc-PAH patients (including uncertainties in the model fit). Multiple numbers of clusters were modeled, with four eventually chosen based on optimal model fit and numbers of patients per cluster. Descriptive statistics of demographic, baseline clinical, echocardiographic, and hemodynamic variables of the study cohort were performed using means and standard deviations for parametrically distributed data and medians and inter-quartile ranges for non-parametric variables. Continuously distributed variables were compared using one-way ANOVA and categorically distributed variables were compared using chi-square tests between the clusters. A comparison of survival distributions between the four clusters was performed using Kaplan-Meier with log-rank testing. In a subset of patients with available repeat RHC data (N = 55), we analyzed the “between-cluster” differences in the trends of these invasive hemodynamic parameters. We used a p - value < 0.05 to determine significance. All statistical analyses were performed using SAS version 9.4 (Cary, NC).
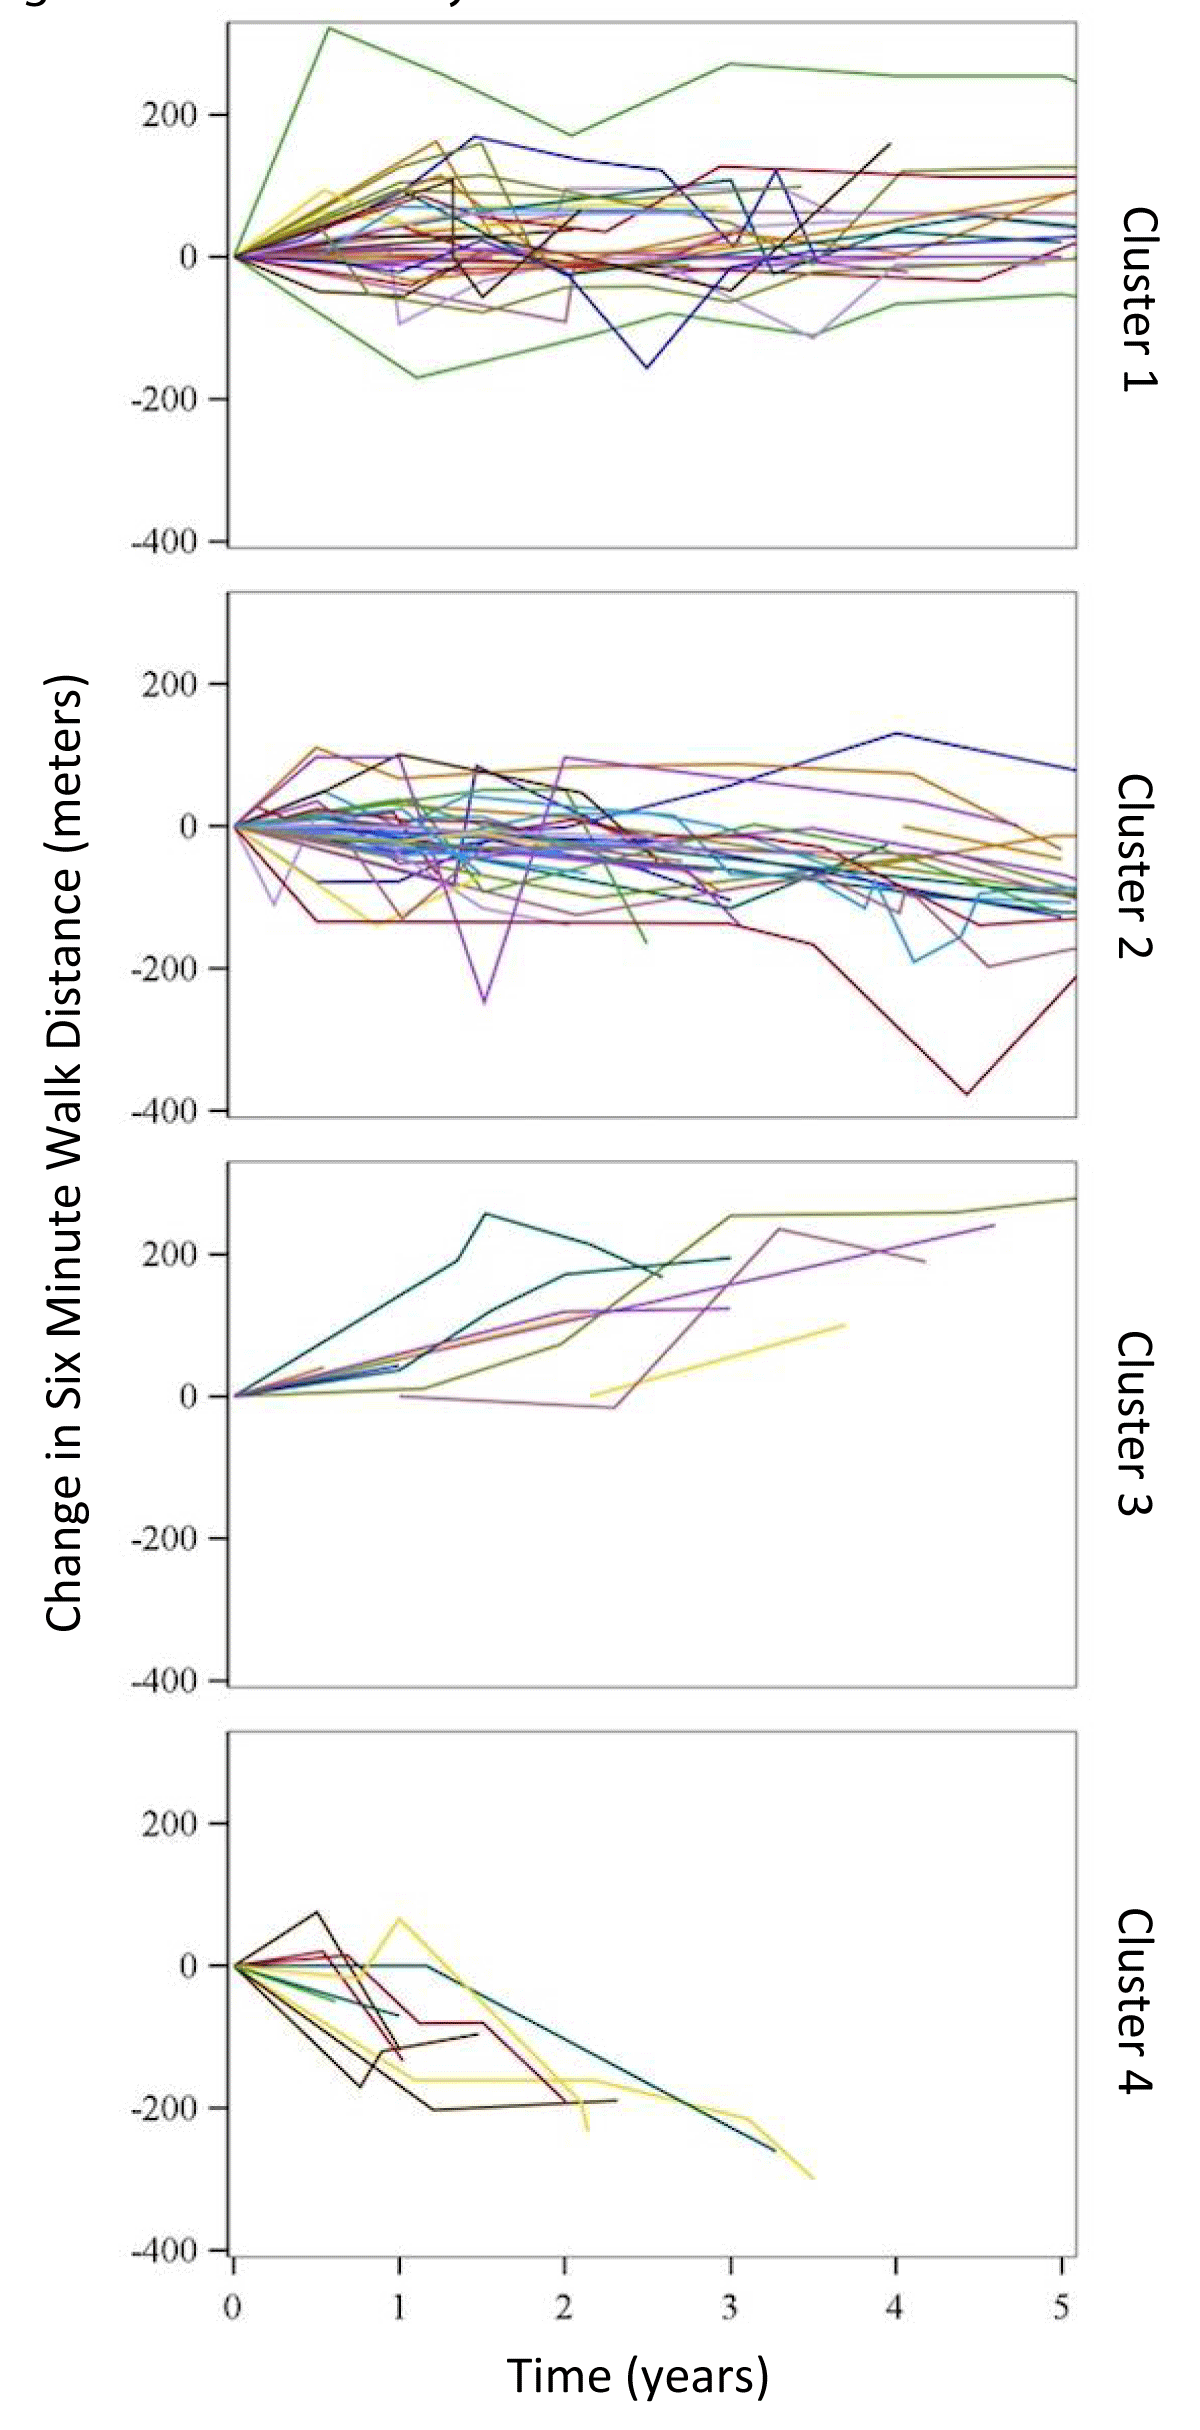
Figure 2: Cluster analysis.
Patient demographics and cluster characteristics at baseline
We identified 103 patients with incident physician-determined SSc-PAH with at least two recorded values for the four different clinical parameters: 6MWD, BNP, SF-36, and WHO FC in the PHAROS database. As detailed above, using latent class modeling for trends in 6MWD over time, we were able to identify four distinct latent clusters of SSc-PAH patients (cluster 1 (N = 38); cluster 2 (N = 44); cluster 3 (N = 11) & cluster 4 (N = 10)). Spaghetti plots displaying the change in 6MWD over time for each cluster are displayed in Figure 2. Cluster 4 (mean age 68.4 (SD = 10.7) years) was older than clusters 1, 2 & 3 (mean age 58.2 (SD = 9.2), 60.4 (SD = 7.8), 59.9 (SD = 10.8) years respectively, Table 1). The median duration of SSc prior to the diagnosis of PAH for the entire cohort was 7.0 years without significant between-cluster differences. A majority of the patients were WHO FC II or III (40% and 39%, respectively) at diagnosis, with only 6% of patients initially presenting with WHO FC IV symptoms (Table 1). There were no significant differences between the clusters regarding WHO FC at baseline. SF-36 results were also not significantly different between the groups at baseline. The mean baseline 6MWD for the entire cohort was 350 meters (SD = 129). Cluster 3 had a lower baseline 6MWD (235.7m (SD = 153.5)) when compared to the other clusters, and Cluster 4 had the highest baseline 6MWD (386.1m (SD = 120)). Additional baseline characteristics can be found in Table 1.
| Table 1: Baseline characteristics for PHAROS SSc-PAH clusters. | |||||||
| Variable | Total N = 103 | Cluster 1 N = 38 | Cluster 2 N = 44 | Cluster 3 N = 11 | Cluster 4 N = 10 | p - value | |
| Age | 60.1(10.2) | 58.2(9.24) | 59.9(10.79) | 60.4(7.75) | 68.4(10.7) | 0.045 | |
| Gender | Male | 12 | 3 | 3 | 3 | 3 | 0.06 |
| Female | 91 | 35 | 41 | 8 | 7 | ||
| Ethnicity | White | 81 | 27 | 37 | 8 | 9 | 0.88 |
| Hispanic | 6 | 2 | 1 | 2 | 1 | ||
| Black | 10 | 5 | 4 | 1 | 0 | ||
| Native American | 1 | 1 | 0 | 0 | 0 | ||
| Asian/Pacific Islander | 2 | 1 | 1 | 0 | 0 | ||
| Other | 2 | 1 | 1 | 0 | 0 | ||
| SF-36 | 29.5(9.22) | 28.6(8.55) | 30.6(10.2) | 28.8(8.96) | 28.9(8.21) | 0.77 | |
| 6MWD | 350.4(129.2) | 336.8(131.5) | 382.6(106.5) | 235.7(153.5) | 386.1(120) | 0.004 | |
| SHAQ Disability Index | 1.0(0.72) | 1.1(0.81) | 0.92(0.72) | 1.1(0.60) | 0.93(0.46) | 0.77 | |
| BNP | 127(57, 380) | 124(47, 245.5) | 127(80,532.5) | 154(65, 1335) | 84(17, 136) | 0.67‡ | |
| Creatinine | 1.03(0.65) | 0.97(0.29) | 1.12(0.93) | 0.92(0.25) | 0.95(0.36) | 0.67 | |
| WHO Functional Class (%) | 1 | 15.5 | 13.1 | 20.5 | 9.1 | 10 | 0.61† |
| 2 | 39.8 | 42.1 | 36.4 | 27.3 | 60 | ||
| 3 | 38.8 | 34.2 | 40.9 | 54.6 | 30 | ||
| 4 | 5.8 | 10.5 | 2.27 | 9.1 | 0 | ||
| PFT | FVC (%) | 82.1(15.4) | 83.4(13.9) | 82.7(16.3) | 77.8(20.2) | 80.1(14.8) | 0.47 |
| FEV1/FVC | 81.2(12.8) | 81.5(16.0) | 79(8.3) | 87.9(12.8) | 83.7(11.2) | 0.19 | |
| DLCO | 43.1(14.4) | 42.5(14.6) | 43.2(14.4) | 47.4(15.6) | 40.8(12.7) | 0.73 | |
| Abnormal CT Chest (%) | 83 | 76 | 89 | 89 | 78 | 0.45 | |
| SSc disease duration (years) | 7.0(8.3) | 7.7(9.2) | 7.9(8.6) | 5.1(5.6) | 2.6(3.0) | 0.25 | |
| ERA ever (%) | 57 | 63 | 57 | 45 | 50 | 0.71 | |
| PDEi ever (%) | 83 | 82 | 82 | 91 | 80 | 0.89 | |
| Baseline demographics and clinical measures across clusters and in total. Continuous measures are presented as a mean (standard deviation) and tested using an ANOVA model unless otherwise stated. Categorical measures are presented as N (%) and tested using a chi-square test unless otherwise stated. Baseline FVC values are not available for 4 patients. Baseline DLCO values are not available for 9 patients. Abnormal CT chest was defined by the presence of fibrosis, honeycombing, or ground-glass opacities on the radiologist read. 6MWD: 6-Minute Walk Distance; BNP: Brain Natriuretic Peptide; DLCO: Diffusing Capacity for Carbon Monoxide; ERA: Endothelin Receptor Antagonist; FEV1: Forced Expiratory Volume in 1 Second; FVC: Forced Vital Capacity; PDEi: Phosphodiesterase Inhibitor; PFT: Pulmonary Function Test; SF-36: Short Form (36) Health Survey; SSc: Systemic Sclerosis; WHO: World Health Organization; ‡: measure presented as a median (25th, 75th) and tested using a Kruskal-Wallis test. | |||||||
There were no other significant differences between the clusters with regard to other baseline demographic or clinical variables. Importantly, the baseline functional disability index as determined by the Scleroderma Health Assessment Questionnaire (SHAQ), was similar between the clusters [23]. There were also no discernible differences with regard to treatment history (PDE5 inhibitor or endothelin receptor antagonist use) between the four clusters. A comparison of demographic data between included and excluded patients can be found in the Supplemental Appendix.
Baseline hemodynamics
Baseline hemodynamic data as assessed by both transthoracic echocardiogram (TTE) and RHC are detailed in Table 2. There were no significant between-cluster differences with regard to the baseline right-ventricular systolic pressure (RVSP), LV ejection fraction (EF), pulmonary capillary wedge pressure (PCWP), cardiac output (CO), pulmonary vascular resistance (PVR), or systolic pulmonary arterial pressure (sPAP). Mean pulmonary arterial pressure (mPAP) was the only baseline hemodynamic parameter that was significantly different between the clusters, with patients in cluster 4 exhibiting the lowest mean baseline mPAP (32 mmHg (SD = 11)) when compared to clusters 1,2 and 3 (39 mmHg (SD = 12), 34 mmHg (SD = 9), and 42 mmHg (SD = 12) respectively, p = 0.048) (Table 2).
| Table 2: Baseline hemodynamics for PHAROS SSc-PAH clusters. | |||||||
| Variable | Total N = 103 | Cluster 1 N = 38 | Cluster 2 N = 44 | Cluster 3 N = 11 | Cluster 4 N = 10 | p - value | |
| TTE | RVSP (mmHg) | 58(20) | 55(22) | 55(15) | 68(21) | 67(25) | 0.09 |
| EF | 60(7) | 60(8) | 60(6) | 59(5) | 61(11) | 0.94 | |
| RHC | sPAP (mmHg) | 57(19) | 61(20) | 54(16) | 67(23) | 49(15) | 0.06 |
| mPAP(mmHg | 36(11) | 39(12) | 34(9) | 42(12) | 32(11) | 0.048 | |
| PCWP(mmHg) | 10(3) | 10(3) | 9(3) | 10(3) | 8(5) | 0.24 | |
| CO(L/min) | 5.2(1.6) | 5.0(1.6) | 5.5(1.5) | 5.1(2.0) | 4.5(1.7) | 0.27 | |
| PVR(WU) | 4.1(3.1, 8.1) | 4.5(3.1, 9.1) | 4.0(3.2, 6.7) | 6.4(2.7, 12.3) | 4.0(3.4, 11.0) | 0.79‡ | |
| Baseline hemodynamic measures across clusters and in total. Continuous measures are presented as a mean (standard deviation) and tested using an ANOVA model unless otherwise stated. Categorical measures are presented as N (%) and tested using a chi-square test unless otherwise stated. CO: Cardiac Output; Echo: Trans-Thoracic Echocardiogram; EF: Ejection Fraction; mPAP: mean Pulmonary Artery Pressure; PCWP: Pulmonary Capillary Wedge Pressure; PVR: Pulmonary Vascular Resistance; RHC: Right Heart Catheterization; RVSP: Right-Ventricular Systolic Pressure; TTE: Trans-Thoracic Echocardiogram; WU: Wood Units; † = measure was tested using a Fisher’s exact test. ‡ = measure presented as a median (25th, 75th) and tested using a Kruskal-Wallis test. | |||||||
Longitudinal changes in clinical and hemodynamic variables
We then compared average yearly changes for 6MWD, SF-36, and BNP as well as the non-invasive and invasive hemodynamic parameters between the four clusters (Table 3).
| Table 3: Changes in clinical and hemodynamic variables over time between PHAROS SSc-PAH clusters. | |||||||
| Variable | Total N = 103 | Cluster 1 N = 38 | Cluster 2 N = 44 | Cluster 3 N = 11 | Cluster 4 N = 10 | p - value | |
| 6MWD | -8.6(39.3) | 8.8(9.6) | -21.9(12.9) | 60.76(12.3) | -91.75(21.7) | < 0.001 | |
| SF-36 | -0.66(4.9) | -0.25(2.5) | -1.87(5.4) | 1.51(5.7) | 0.73(7.2) | 0.11 | |
| BNP | 21(470.1) | -11(334.4) | -29.9(530.58) | 191.5(402.62) | 532.3(518.8) | 0.21 | |
| TTE | RVSP(mmHg) | -0.4(19.8) | 2.57(10.4) | -2.21(10.3) | -4.15(7.3) | 0.09(55.41) | 0.70 |
| EF | 1.64(5.1) | 1.13(2.4) | 1.73(5.6) | 0.92(3.5) | 3.87(10.1) | 0.58 | |
| RHC | sPAP(mmHg) | 3.01(13.1) | 1.13(10.1) | 2.59(11.7) | -4.88(10.7) | 25.15(19.1) | 0.002 |
| mPAP(mmHg) | 2.00(8.4) | 0.82(6.3) | 1.37(6.6) | -2.46(4.5) | 18.82(14.5) | < 0.001 | |
| PCWP(mmHg) | 1.72(3.6) | 1.06(3.0) | 1.86(3.3) | 0.09(2.52) | 6.95(6.1) | 0.01 | |
| CO(L/min) | -0.23(1.0) | -0.16(1.3) | -0.26(0.7) | -0.42(0.7) | -0.24(1.1) | 0.95 | |
| PVR(WU) | 0.38(2.23) | 0.51(1.81) | 0.16(2.02) | -0.77(2.42) | 2.61(4.18) | 0.11 | |
| Longitudinal average yearly changes across clusters and in total. Repeat TTE (N = 95) and RHC (N = 55) data only available in a subset of patients. Measures are presented as mean differences in value from the baseline. All measures are continuous and presented as mean (standard deviation) and tested using an ANOVA model. 6MWD: 6-Minute Walk Distance; BNP: Brain Natriuretic Peptide; CO: Cardiac Output; EF: Ejection Fraction; mPAP: mean Pulmonary Artery Pressure; PCWP: Pulmonary Capillary Wedge Pressure; PVR: Pulmonary Vascular Resistance; RHC: Right Heart Catheterization; RVSP: Right Ventricular Systolic Pressure; SF-36 = 36-item Short form Survey; sPAP: systolic Pulmonary Artery Pressure; TTE: Trans-Thoracic Echocardiogram. | |||||||
Each patient cluster was characterized by unique trends in 6MWD so the 6MWD trends, as expected, were different between groups. Patients in Cluster 1 had a stable 6MWD, while patients in Cluster 2 had a mild reduction in 6MWD. Cluster 3 exhibited an improvement in 6MWD over time. SSc-PAH patients in cluster 4 exhibited the greatest decline in 6MWD compared to the other clusters (-91.75 meters,
p < 0.001) (Figure 2, Table 3). Clusters 1 & 2 exhibited a mild, favorable trend in BNP (decreasing over time) when compared to clusters 3 & 4 which trended worse (increasing over time), but the between-cluster differences in BNP variation were not statistically significant (p = 0.21). There were no significant differences between clusters with regard to WHO FC or SF-36 trends over time (Table 3).
In the smaller subset of incident SSc-PAH patients with available repeat invasive hemodynamic data (Cluster 1: N = 22/38, Cluster 2: N = 23/44, Cluster 3: N = 6/11, Cluster 4: N = 4/10), patients in cluster 4 exhibited worsening PAH hemodynamics, as evidenced by an increase in sPAP (25.2 mmHg (SD = 19.1), p = 0.002) and mPAP (18.8 mmHg (SD = 14.5), p < 0.001) when compared to the other clusters. PCWP also increased over time in Cluster 4 patients (6.95 mmHg (SD = 6.1), p = 0.011). We did not note any significant between-cluster differences in the changes over time for other hemodynamic parameters, including CO & PVR. We also did not note any significant changes in EF or RVSP for the subset of patients with available repeat TTE data (N = 95 patients).
Survival analysis
The Kaplan-Meier analysis comparing all-cause mortality between clusters is displayed in Figure 3. Patients in Cluster 1 (N = 38) carried the best prognosis, with a median survival of > 9 years from diagnosis. Cluster 2 (N = 44) had the second-best prognosis with a median survival of 7 years. Cluster 3 (N = 11) had the second-worst prognosis with a median survival of 5 years. Patients in Cluster 4 (N = 10) exhibited the worst prognosis with a median survival of just 3 years, representing the disease phenotype with the worst prognosis (Log-rank test p = 0.01) (Figure 3).
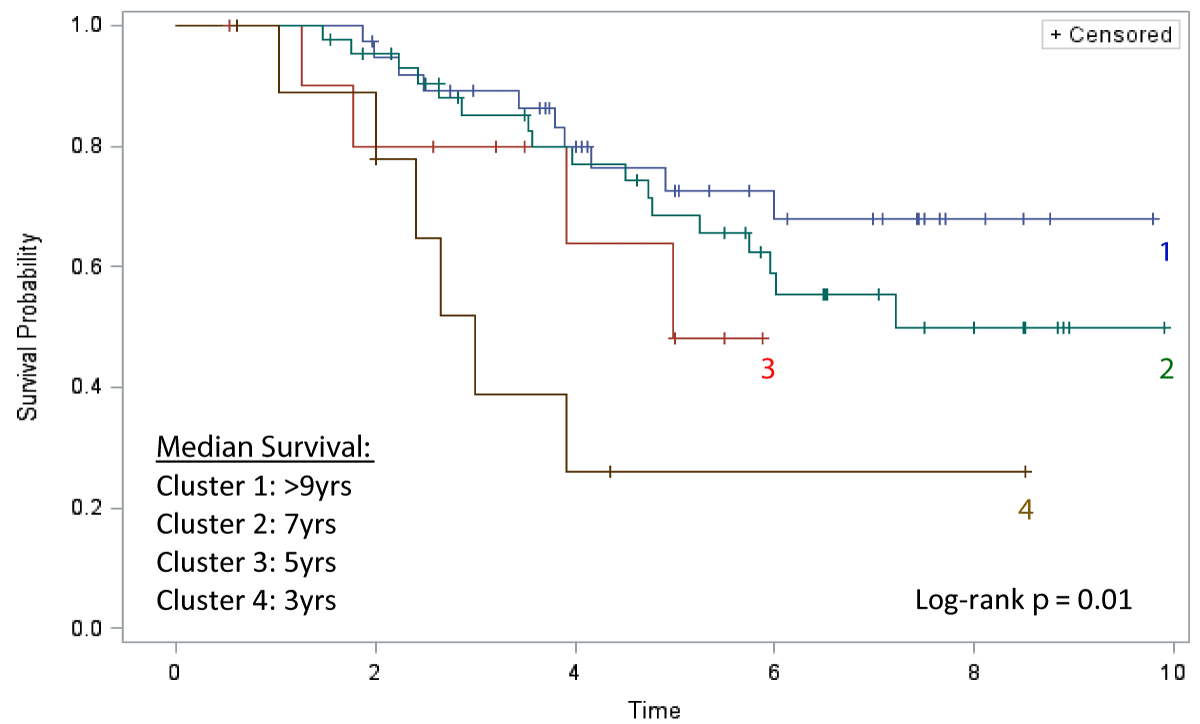
Figure 3: Kaplan-Meier Survival.
Pulmonary arterial hypertension remains a leading cause of mortality in patients with systemic sclerosis. Despite advances in therapy for idiopathic PAH, SSc-PAH remains an aggressive disease with a heterogeneous treatment response to pulmonary arterial vasodilators. Clinical experience among many PH centers shows that while some patients demonstrate relative stability or a very slow progression from the time of diagnosis, a subset of SSc-PAH patients appears to display a rapidly progressive disease course with worsening hemodynamics. Using the change in 6MWD over time, our latent class analysis identified four distinct “endotypes” of SSc-PAH patients with distinct prognostic signatures. From our analysis, cluster 1 patients with a stable 6MWD over time exhibited the best prognosis, whereas cluster 4 patients, despite having the best baseline 6MWD value, exhibited a precipitous decline in their 6MWD value over time and carried the worst all-cause mortality with a very short median survival time (Figure 3). Furthermore, patients in Cluster 3 with the lowest baseline 6MWD also had a survival disadvantage when compared to clusters 1 and 2, despite an improvement in walk distance and a decline in pulmonary artery pressures over time.
While Cluster 4 was older when compared to the other clusters, none of the other demographic, clinical, or hemodynamic parameters sufficiently differentiated this cluster from the others. Baseline 6MWD has previously been noted to be an important prognostic factor in PAH, and indeed patients with the lowest baseline 6MWD in Cluster 3 exhibited a poor prognosis [21,24,25]. However, baseline 6MWD was in fact paradoxically the highest in Cluster 4. The only non-invasive clinical parameter that seemed to distinguish cluster 4 from the other clusters was the significant decline over time in the 6MWD. 6MWD is a reliable prognostic indicator in patients with PAH but change in 6MWD over time has previously had an unclear prognostic significance [21,22,26]. In a study by Fritz, et al. change in 6MWD from baseline to 12 months did not predict survival in a cohort of PAH patients (both IPAH and CTD-PAH) [27]. In contrast, Groepenhoff, et al. in a single institution, prospective study of IPAH patients showed that while baseline 6MWD was no different between survivors and non-survivors, an increase in 6MWD from baseline was significantly associated with survival [28]. In our cohort, cluster 3 with a poor baseline 6MWD demonstrated a survival disadvantage (compared to clusters 1 & 2) despite a significant improvement in 6MWD over time, suggesting that the observations by Groepenhoff, et al. may not apply to incident SSc-PAH patients. Our findings regarding the poor predictive prowess of the baseline 6MWD alone in incident SSc-PAH patients seem consistent with those from Mullin, et al. where a low 6MWD at baseline did not have as strong of an association with poor one-year survival in the SSc-PAH population, as was noted in the original REVEAL model development cohort [17]. Taken together, the findings from our analysis suggest that a decline in 6MWD over time and a low baseline 6MWD both confer a survival disadvantage in incident SSc-PAH patients.
In our study, baseline hemodynamics did not differentiate a high-risk SSc-PAH patient phenotype. Further, cluster 4, which had the worst prognosis, had a lower baseline mPAP than the other clusters (31.7 mmHg). In a smaller subset of patients with available repeat RHC data, Cluster 4 demonstrated worse hemodynamics, suggesting that a rapid progression of pulmonary vascular disease could still be the mechanistic etiology that explains the survival disadvantage in this cluster. Interestingly, Cluster 4 also had a significant increase in PCWP from baseline, albeit without significant changes in CO or EF. Patients with SSc-PAH often have co-existing LV dysfunction, especially with advanced age, which may make it difficult for SSc-PAH patients to tolerate some of these medications, especially ERAs (endothelin receptor antagonists). We speculate that in the highest-risk cluster, the significant increase in PCWP from the baseline value with therapy could potentially indicate the presence of comorbid LV pathologies, as is common in SSc patients [29,30]. Another possible explanation for this observation could be that in this cluster, worsening RV dysfunction and pressure overloading could have led to interventricular septal flattening and bowing into the left ventricular lumen resulting in elevated LV filling pressures [31]. Since repeating invasive hemodynamic testing may not always be possible or convenient, trending 6MWD over time may serve as a useful surrogate in the identification of these high-risk patients who might potentially benefit from an aggressive up-titration in therapies or even early referral to lung transplantation.
It should be noted that the diagnosis of WHO Group 1 PAH in our study was physician-determined, based on enrollment criteria in the PHAROS registry [11,32]. These criteria did not include a PVR cutoff based on contemporary guidelines, and thus there were several patients included with a baseline PVR < 3 WU, which would not meet current WSPH criteria for PAH but would meet the most updated ESC/ERS definition [19,33]. Importantly, all patients were managed as PAH by the enrolling physicians, providing some external validity and real-world practicality to our study results. Patients with SSc-PAH often present with co-existing PH phenotypes (PH due to ILD & PH due to LV dysfunction) and it can be difficult to distinguish the predominant driver of RV dysfunction [29].
Given that this was an observational cohort study dependent on multi-center database enrollment, it was limited by the availability of follow-up data. While we included 103 patients in our analysis, a repeat TTE was only available for 95 patients, and repeat RHC was available for 55 patients. We also observed that there was a noteworthy difference in follow-up time between the clusters, particularly in Cluster 4, which had limited 6MWD data after one year. While a simple explanation for this could be the short survival time for this cohort, it could also be due to patients’ worsening functional status and their inability to perform repeat exercise testing.
SSc-PAH remains a complex disease with many phenotypes, and our analysis displays unique endotypes that appear to have distinct prognostic signatures. A significant decline in 6MWD over time seems to confer a survival disadvantage in SSc-PAH. A low baseline 6MWD, independent of improvements in functional or hemodynamic measures over time, also appears to be associated with decreased survival. Our findings will need to be validated in larger SSc-PAH cohorts from around the world, particularly delineating the differences between isolated and mixed PH subgroups. Identifying and understanding high-risk groups in this unique disease is important in developing disease-specific guidelines and more precise therapeutic options.
Financial/nonfinancial disclosures
RGA serves on the advisory board for Janssen Pharmaceuticals, United Therapeutics, and Accordant Health. RGA has participated in disease-state-specific speaking engagements for United Therapeutics. RGA has also received educational grants from Reata Pharmaceuticals. The PHAROS registry is funded by unrestricted grants by Actelion Inc. and Gilead Inc., with additional support from The Scleroderma Foundation and the Markley Foundation. These sponsors had no role in the design of this study, data analysis, or manuscript preparation.
Author contributions
The first author (SHF) and senior author (RGA) were responsible for study design, data compilation, and manuscript preparation. NF contributed significantly to study conception, data acquisition, and manuscript revision. Statisticians (JW, MH, and VR) provided independent data review, and statistical analysis, and assisted with the writing of the methods section. MRL and VDS are responsible for compiling and maintaining the PHAROS database and contributing to the revision of the manuscript.
Notation of prior abstract publication/presentation
Preliminary data from this study was presented in poster format at the ATS Conference 2019 in San Diego, CA, and the ATS Conference 2022 in San Francisco, CA.
- Denton CP, Khanna D. Systemic sclerosis. Lancet. 2017 Oct 7;390(10103):1685-1699. doi: 10.1016/S0140-6736(17)30933-9. Epub 2017 Apr 13. PMID: 28413064.
- Steen VD, Medsger TA. Changes in causes of death in systemic sclerosis, 1972-2002. Ann Rheum Dis. 2007 Jul;66(7):940-4. doi: 10.1136/ard.2006.066068. Epub 2007 Feb 28. PMID: 17329309; PMCID: PMC1955114.
- Chaisson NF, Hassoun PM. Systemic sclerosis-associated pulmonary arterial hypertension. Chest. 2013 Oct;144(4):1346-1356. doi: 10.1378/chest.12-2396. PMID: 24081346; PMCID: PMC3787920.
- Thenappan T, Shah SJ, Rich S, Gomberg-Maitland M. A USA-based registry for pulmonary arterial hypertension: 1982-2006. Eur Respir J. 2007 Dec;30(6):1103-10. doi: 10.1183/09031936.00042107. Epub 2007 Sep 5. PMID: 17804449.
- Humbert M, Sitbon O, Chaouat A, Bertocchi M, Habib G, Gressin V, Yaici A, Weitzenblum E, Cordier JF, Chabot F, Dromer C, Pison C, Reynaud-Gaubert M, Haloun A, Laurent M, Hachulla E, Simonneau G. Pulmonary arterial hypertension in France: results from a national registry. Am J Respir Crit Care Med. 2006 May 1;173(9):1023-30. doi: 10.1164/rccm.200510-1668OC. Epub 2006 Feb 2. PMID: 16456139.
- Young A, Nagaraja V, Basilious M, Habib M, Townsend W, Gladue H, Badesch D, Gibbs JSR, Gopalan D, Manes A, Oudiz R, Satoh T, Torbicki A, Torres F, McLaughlin V, Khanna D. Update of screening and diagnostic modalities for connective tissue disease-associated pulmonary arterial hypertension. Semin Arthritis Rheum. 2019 Jun;48(6):1059-1067. doi: 10.1016/j.semarthrit.2018.10.010. Epub 2018 Oct 14. PMID: 30415942; PMCID: PMC7155785.
- Schoenfeld SR, Castelino FV. Evaluation and management approaches for scleroderma lung disease. Ther Adv Respir Dis. 2017 Aug;11(8):327-340. doi: 10.1177/1753465817713680. Epub 2017 Jun 16. PMID: 28621173; PMCID: PMC5933653.
- Humbert M, Sitbon O, Simonneau G. Treatment of pulmonary arterial hypertension. N Engl J Med. 2004 Sep 30;351(14):1425-36. doi: 10.1056/NEJMra040291. PMID: 15459304.
- Rhee RL, Gabler NB, Sangani S, Praestgaard A, Merkel PA, Kawut SM. Comparison of Treatment Response in Idiopathic and Connective Tissue Disease-associated Pulmonary Arterial Hypertension. Am J Respir Crit Care Med. 2015 Nov 1;192(9):1111-7. doi: 10.1164/rccm.201507-1456OC. PMID: 26291092; PMCID: PMC4642205.
- Rubenfire M, Huffman MD, Krishnan S, Seibold JR, Schiopu E, McLaughlin VV. Survival in systemic sclerosis with pulmonary arterial hypertension has not improved in the modern era. Chest. 2013 Oct;144(4):1282-1290. doi: 10.1378/chest.12-0653. PMID: 23744060.
- Hinchcliff M, Fischer A, Schiopu E, Steen VD; PHAROS Investigators. Pulmonary Hypertension Assessment and Recognition of Outcomes in Scleroderma (PHAROS): baseline characteristics and description of study population. J Rheumatol. 2011 Oct;38(10):2172-9. doi: 10.3899/jrheum.101243. Epub 2011 Aug 15. PMID: 21844142; PMCID: PMC3230328.
- Kolstad KD, Li S, Steen V, Chung L; PHAROS Investigators. Long-Term Outcomes in Systemic Sclerosis-Associated Pulmonary Arterial Hypertension From the Pulmonary Hypertension Assessment and Recognition of Outcomes in Scleroderma Registry (PHAROS). Chest. 2018 Oct;154(4):862-871. doi: 10.1016/j.chest.2018.05.002. Epub 2018 May 16. PMID: 29777655; PMCID: PMC6207791.
- Ramjug S, Hussain N, Hurdman J, Billings C, Charalampopoulos A, Elliot CA, Kiely DG, Sabroe I, Rajaram S, Swift AJ, Condliffe R. Idiopathic and Systemic Sclerosis-Associated Pulmonary Arterial Hypertension: A Comparison of Demographic, Hemodynamic, and MRI Characteristics and Outcomes. Chest. 2017 Jul;152(1):92-102. doi: 10.1016/j.chest.2017.02.010. Epub 2017 Feb 20. PMID: 28223154.
- Morrisroe K, Stevens W, Huq M, Prior D, Sahhar J, Ngian GS, Celermajer D, Zochling J, Proudman S, Nikpour M; Australian Scleroderma Interest Group (ASIG). Survival and quality of life in incident systemic sclerosis-related pulmonary arterial hypertension. Arthritis Res Ther. 2017 Jun 2;19(1):122. doi: 10.1186/s13075-017-1341-x. PMID: 28576149; PMCID: PMC5457656.
- Badesch DB, Raskob GE, Elliott CG, Krichman AM, Farber HW, Frost AE, Barst RJ, Benza RL, Liou TG, Turner M, Giles S, Feldkircher K, Miller DP, McGoon MD. Pulmonary arterial hypertension: baseline characteristics from the REVEAL Registry. Chest. 2010 Feb;137(2):376-87. doi: 10.1378/chest.09-1140. Epub 2009 Oct 16. PMID: 19837821.
- Benza RL, Gomberg-Maitland M, Elliott CG, Farber HW, Foreman AJ, Frost AE, McGoon MD, Pasta DJ, Selej M, Burger CD, Frantz RP. Predicting Survival in Patients With Pulmonary Arterial Hypertension: The REVEAL Risk Score Calculator 2.0 and Comparison With ESC/ERS-Based Risk Assessment Strategies. Chest. 2019 Aug;156(2):323-337. doi: 10.1016/j.chest.2019.02.004. Epub 2019 Feb 14. PMID: 30772387.
- Mullin CJ, Khair RM, Damico RL, Kolb TM, Hummers LK, Hassoun PM, Steen VD, Mathai SC; PHAROS Investigators. Validation of the REVEAL Prognostic Equation and Risk Score Calculator in Incident Systemic Sclerosis-Associated Pulmonary Arterial Hypertension. Arthritis Rheumatol. 2019 Oct;71(10):1691-1700. doi: 10.1002/art.40918. Epub 2019 Aug 26. PMID: 31066998.
- Galiè N, Humbert M, Vachiery JL, Gibbs S, Lang I, Torbicki A, Simonneau G, Peacock A, Vonk Noordegraaf A, Beghetti M, Ghofrani A, Gomez Sanchez MA, Hansmann G, Klepetko W, Lancellotti P, Matucci M, McDonagh T, Pierard LA, Trindade PT, Zompatori M, Hoeper M; ESC Scientific Document Group. 2015 ESC/ERS Guidelines for the diagnosis and treatment of pulmonary hypertension: The Joint Task Force for the Diagnosis and Treatment of Pulmonary Hypertension of the European Society of Cardiology (ESC) and the European Respiratory Society (ERS): Endorsed by: Association for European Paediatric and Congenital Cardiology (AEPC), International Society for Heart and Lung Transplantation (ISHLT). Eur Heart J. 2016 Jan 1;37(1):67-119. doi: 10.1093/eurheartj/ehv317. Epub 2015 Aug 29. PMID: 26320113.
- Simonneau G, Montani D, Celermajer DS, Denton CP, Gatzoulis MA, Krowka M, Williams PG, Souza R. Haemodynamic definitions and updated clinical classification of pulmonary hypertension. Eur Respir J. 2019 Jan 24;53(1):1801913. doi: 10.1183/13993003.01913-2018. PMID: 30545968; PMCID: PMC6351336.
- Weller BE, Bowen NK, Faubert SJ. Latent Class Analysis: A Guide to Best Practice. Journal of Black Psychology. 2020; 46(4):287-311.
- Demir R, Küçükoğlu MS. Six-minute walk test in pulmonary arterial hypertension. Anatol J Cardiol. 2015 Mar;15(3):249-54. doi: 10.5152/akd.2015.5834. PMID: 25880178; PMCID: PMC5337064.
- Moutchia J, McClelland RL, Al-Naamani N, Appleby DH, Blank K, Grinnan D, Holmes JH, Mathai SC, Minhas J, Ventetuolo CE, Zamanian RT, Kawut SM. Minimal Clinically Important Difference in the 6-minute-walk Distance for Patients with Pulmonary Arterial Hypertension. Am J Respir Crit Care Med. 2023 Apr 15;207(8):1070-1079. doi: 10.1164/rccm.202208-1547OC. PMID: 36629737; PMCID: PMC10112451.
- Steen VD, Medsger TA Jr. The value of the Health Assessment Questionnaire and special patient-generated scales to demonstrate change in systemic sclerosis patients over time. Arthritis Rheum. 1997 Nov;40(11):1984-91. doi: 10.1002/art.1780401110. PMID: 9365087.
- Rizzi M, Radovanovic D, Santus P, Airoldi A, Frassanito F, Vanni S, Cristiano A, Sarzi-Puttini P, Atzeni F. Usefulness of six-minute walk test in systemic sclerosis. Clin Exp Rheumatol. 2018 Jul-Aug;36 Suppl 113(4):161-167. Epub 2018 Sep 7. PMID: 30277863.
- Vandecasteele E, Melsens K, De Keyser F, De Pauw M, Deschepper E, Decuman S, Piette Y, Thevissen K, Brusselle G, Smith V. A prospective, longitudinal study evaluating the baseline six-minute walk test as an individual reference value in systemic sclerosis patients. Clin Exp Rheumatol. 2018 Jul-Aug;36 Suppl 113(4):95-101. Epub 2018 Aug 28. PMID: 30183593.
- Gabler NB, French B, Strom BL, Palevsky HI, Taichman DB, Kawut SM, Halpern SD. Validation of 6-minute walk distance as a surrogate end point in pulmonary arterial hypertension trials. Circulation. 2012 Jul 17;126(3):349-56. doi: 10.1161/CIRCULATIONAHA.112.105890. Epub 2012 Jun 13. PMID: 22696079; PMCID: PMC4237273.
- Fritz JS, Blair C, Oudiz RJ, Dufton C, Olschewski H, Despain D, Gillies H, Kawut SM. Baseline and follow-up 6-min walk distance and brain natriuretic peptide predict 2-year mortality in pulmonary arterial hypertension. Chest. 2013 Feb 1;143(2):315-323. doi: 10.1378/chest.12-0270. PMID: 22814814; PMCID: PMC4694187.
- Groepenhoff H, Vonk-Noordegraaf A, van de Veerdonk MC, Boonstra A, Westerhof N, Bogaard HJ. Prognostic relevance of changes in exercise test variables in pulmonary arterial hypertension. PLoS One. 2013 Sep 5;8(9):e72013. doi: 10.1371/journal.pone.0072013. PMID: 24039732; PMCID: PMC3764059.
- Launay D, Sobanski V, Hachulla E, Humbert M. Pulmonary hypertension in systemic sclerosis: different phenotypes. Eur Respir Rev. 2017 Sep 27;26(145):170056. doi: 10.1183/16000617.0056-2017. PMID: 28954767; PMCID: PMC9488608.
- Lammi MR, Saketkoo LA, Gordon JK, Steen VD. Changes in hemodynamic classification over time are common in systemic sclerosis-associated pulmonary hypertension: insights from the PHAROS cohort. Pulm Circ. 2018 Apr-Jun;8(2):2045893218757404. doi: 10.1177/2045893218757404. PMID: 29468935; PMCID: PMC5826006.
- Naeije R, Badagliacca R. The overloaded right heart and ventricular interdependence. Cardiovasc Res. 2017 Oct 1;113(12):1474-1485. doi: 10.1093/cvr/cvx160. PMID: 28957537.
- Badesch DB, Champion HC, Gomez Sanchez MA, Hoeper MM, Loyd JE, Manes A, McGoon M, Naeije R, Olschewski H, Oudiz RJ, Torbicki A. Diagnosis and assessment of pulmonary arterial hypertension. J Am Coll Cardiol. 2009 Jun 30;54(1 Suppl):S55-S66. doi: 10.1016/j.jacc.2009.04.011. PMID: 19555859.
- Humbert M, Kovacs G, Hoeper MM, Badagliacca R, Berger RMF, Brida M, Carlsen J, Coats AJS, Escribano-Subias P, Ferrari P, Ferreira DS, Ghofrani HA, Giannakoulas G, Kiely DG, Mayer E, Meszaros G, Nagavci B, Olsson KM, Pepke-Zaba J, Quint JK, Rådegran G, Simonneau G, Sitbon O, Tonia T, Toshner M, Vachiery JL, Vonk Noordegraaf A, Delcroix M, Rosenkranz S; ESC/ERS Scientific Document Group. 2022 ESC/ERS Guidelines for the diagnosis and treatment of pulmonary hypertension. Eur Heart J. 2022 Oct 11;43(38):3618-3731. doi: 10.1093/eurheartj/ehac237. Erratum in: Eur Heart J. 2023 Apr 17;44(15):1312. PMID: 36017548.